Understanding Parametric Blending Presentation State Storage
Explore the concept of Parametric Blending Presentation State Storage, which allows showcasing spatial relationships between parametric maps and structural images while retaining usability. This innovative method involves blending different data sets, applying thresholds, and highlighting important areas for surgery and therapy planning. Learn how to combine anatomical images with parametric maps and DTI maps for effective visualization in medical imaging.

Download Presentation

Please find below an Image/Link to download the presentation.
The content on the website is provided AS IS for your information and personal use only. It may not be sold, licensed, or shared on other websites without obtaining consent from the author. Download presentation by click this link. If you encounter any issues during the download, it is possible that the publisher has removed the file from their server.
E N D
Presentation Transcript
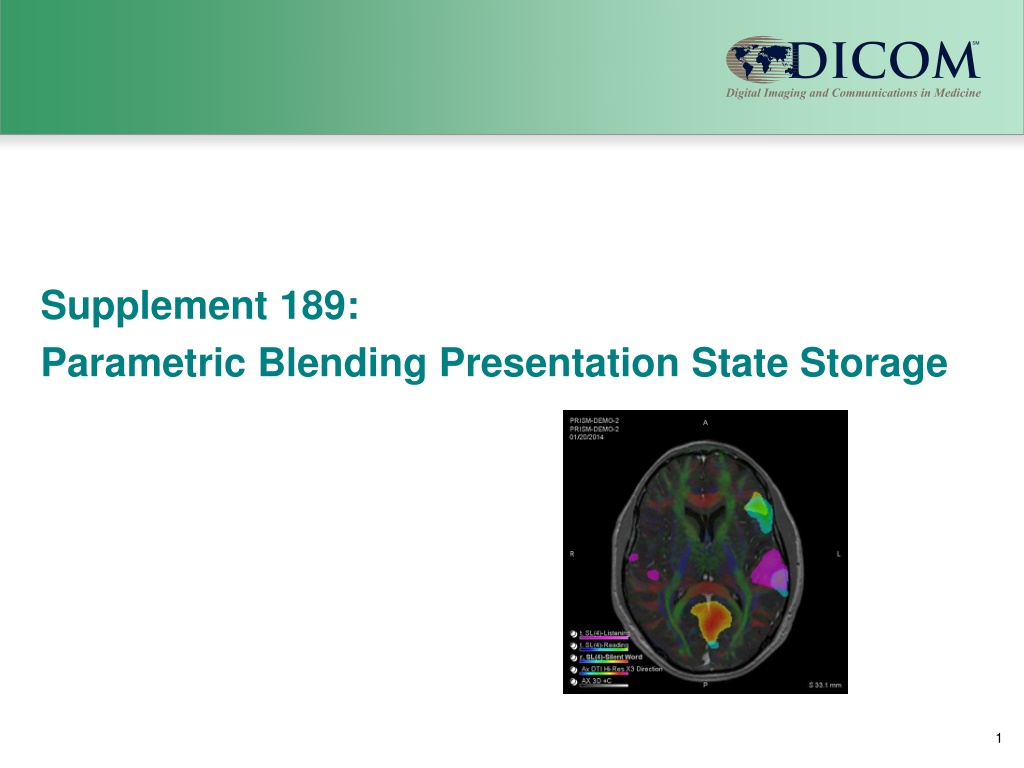
Supplement 189: Parametric Blending Presentation State Storage 1
Overview Objective Input data Blending operation Example 2 Blending Presentation State introduction
Objective Allowing to show spatial relationship of the parametric maps and structural images without loosing the ability to use: Geometry Spatial and Parametric Information Thresholds Major usage for Surgery and Therapy planning Is Modality independent 3 Blending Presentation State introduction
Input Data Describing the different information sets that will be blended: Structural dataset(s) for anatomy Parametric Maps for Functional Information 4 Blending Presentation State introduction
Blending operation Apply Threshold to highlight the important areas Supports the use of the Color information in the input datasets Blends the different datasets in specified order without losing the color information 5 Blending Presentation State introduction
Blending operation Requires Frame of Reference Supports usage of Padding Graphics overlays Segmented Color LUT description Real World value measurements Expects CP 1584 to be finalized for color support in Parametric maps. 6 Blending Presentation State introduction
Example Use case is brain mapping for pre-treatment planning. The goal is to visualize white matter, eloquent cortex for language with respect to the anatomy - - White matter is done by Color DTI Eloquent cortex is done by multiple language fMRI paradigms Anatomy is post contrast T1 - Blending Presentation State introduction 7
Example Result View combining: - Anatomical image - 3 parametric maps - DTI map Using: Thresholds Opacity Blending Presentation State introduction 8
Individual Images Anatomical Blending Presentation State introduction 9
Individual Images Parametric map showing coloring and applying threshold coloring of the image Blending Presentation State introduction 10
Individual Images Parametric map showing coloring and applying threshold coloring of the image Blending Presentation State introduction 11
Individual Images Parametric map showing coloring and applying threshold coloring of the image Blending Presentation State introduction 12
Individual Images RGB image showing the DTI information having no threshold Blending Presentation State introduction 13
Input images (mono, color and LUT) Input images (mono, color and LUT) + Relative Opacity 0.6 DTI (Relative Opacity 0.3) Anatomical (Relative Opacity 0.7) Relative Opacity 0.4 + + fMRI (Relative Opacity 0.33) fMRI (Relative Opacity 0.33) fMRI (Relative Opacity 0.33)
Coloring operation Coloring operation Apply Color LUT (optional) Full Color Image Thresholded Color Image Input for Blending Stored Values (RWV) Convert Grayscale to RGB if no LUT is specified Applying color LUT is null operation if input is RGB image Applying Threshold is an optional step Apply (RWV) Threshold (optional)
Blending operation Blending operation Blending mode FOREGROUND Requires Relative Opacity (RO) Only valid with 2 input images Both inputs padding value output padding value One input non-padding value output non-padding value Both inputs non-padding value output RO * value1 + (1 RO) * value2 Relative Opacity Color Image 1 Blend Color Images Input for Blending or Display Color Image 2 1 - Relative Opacity
Blending operation Blending operation Relative Opacity Blending mode EQUAL Relative Opacity = 0 if pixel is NOT contributing Relative Opacity = 1/n* if pixel is contributing No restriction on n n* is number of contributing pixels 0 or 1 / n* Color Image 1 0 or 1 / n* Blend Color Images Color Image 2 Input for Blending or Display 0 or 1 / n* Color Image n
Result view Result view after blending of the different images Blending Presentation State introduction 18
Result view Result view after blending of the different images with application added information. Blending Presentation State introduction 19
What is not specified The algorithms used to make the different spatial datasets map to each other Windowing of gray scale information before it is colored and blended Blending Presentation State introduction 20


")