Geographic Analysis of the U.S. Disability Belt
A spatial analysis of the U.S. Disability Belt, funded by NIDILRR, explores the clustering of disability prevalence in specific regions like Appalachia and the Southeast Coastal Plains. The research aims to understand contextual factors influencing disability distribution and identify high-risk clusters for targeted interventions using spatial statistics and regression models.

Download Presentation

Please find below an Image/Link to download the presentation.
The content on the website is provided AS IS for your information and personal use only. It may not be sold, licensed, or shared on other websites without obtaining consent from the author. Download presentation by click this link. If you encounter any issues during the download, it is possible that the publisher has removed the file from their server.
E N D
Presentation Transcript
The U.S. Disability Belt: A Spatial Analysis of Geographic Variation in Disability Amanda Botticello, PhD, MPH Andrew Houtenville, PhD John O Neill, PhD *This research is funded by the National Institute for Disability and Rehabilitation Research (NIDILRR), grant H133B130015.
Background: The Disability Belt refers to the geographic clustering of areas with a high prevalence of disability. High disability areas included contiguous clusters of counties in Appalachia, the lower Mississippi Valley, the Southeast Coastal Plains, and Missouri and Oklahoma. The disability belt areas overlap generally with areas of reported high concentrations of chronic health conditions.
Background: Understanding geographic variation is important for understanding how area characteristics demographic, social, physical, and institutional affect disability prevalence. Evidence of clustering can be used by state and local health agencies to target policy and interventions to high-risk areas.
Background Limitations of prior research Prior analyses have been largely descriptive and visual. More recently, work on geographic variation in health conditions has moved to identifying high risk clusters with spatial statistics. Information based on singular data sources. Labor market participation data. Survey data that offers a broader perspective on the experience of disability and disability type. Focus on high prevalence areas. Areas with low prevalence disability are similarly important for understanding the contextual influences of disability.
Research Questions I. How does the geographic distribution of disability compare across different data and disability types? Is the spatial clustering of disability significant and where are these clusters located? III. What contextual factors are associated with geographic variation in the distribution of disability? Socioeconomic. Disability types. II.
Analytic Approach I. Mapping: To visualize and compare the distribution of disability prevalence and program participation. Spatial clustering: To detect areas with significant concentrations of reported disability. a. Spatial auto-correlation statistics were calculated to assess global spatial clustering (Moran s I). b. Univariate LISA analysis used to identify statistically significant hot and cold spots (p < 0.01). III. Contextualizing: Lagged spatial regression models were estimated to assess the relationship between county-level SES and disability. II.
Sources of Data Disability data: American Community Survey (ACS) pooled five-year sample (US Census Bureau). Old-Age, Survivors, and Disability Insurance (OASDI) program participants (Social Security Administration). Spatial data: US Census TIGERLINE files. Attribute data: ACS pooled five-year sample. Median household income ($10,000), % unemployed, % households receiving public assistance, % persons with high school diploma. All data: 2010. County-level (N = 3,109) in the 48 contiguous United States. All analyses were conducted in GeoDa version 1.8.14.
Disability Prevalence American Community Survey (ACS) data. Six self-reported questions assessing functioning difficulties. Hearing, vision, cognition, ambulation, self care, or independent living. Percent disabled = (1+ disability/Total working age population)*100% Social Security Administration (SSA) data. Social Security Disability Insurance (SSDI) recipients. Persons no longer able to work due to disability. Percent disabled = (Total disabled workers /Total working age population)*100%. *Working-Age Population: Total county population 18-64 years.
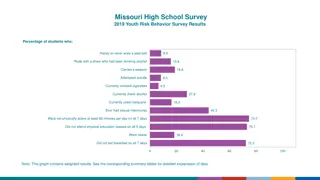
Distributions of Disability Prevalence Mean SD Min Med Max % SSDI Disability 5.9 2.6 0.5 5.4 22.9 % ACS Disability 13.4 4.7 1.0 12.8 35.6 Disability Type: % Hearing % Vision % Ambulation % Cognition % Self Care % Independent Living 3.1 2.4 7.1 5.4 2.4 4.6 1.4 1.5 3.2 2.3 1.2 2.1 0.0 0.0 0.0 0.0 0.0 0.0 2.9 2.1 6.6 5.0 2.2 4.2 3.8 3.0 9.0 6.6 3.0 5.7
Results: ACS Disability Quantiles
Results: SSDI Disability Quantiles
Results: Spatial autocorrelation, Disability Prevalence z-score p-value Moran s I % SSDI Disability % ACS Disability Disability Type: % Hearing % Vision % Ambulation % Cognition % Self Care % Independent Living 0.70 0.60 67.1 57.0 0.00 0.00 0.42 0.51 0.62 0.52 0.46 0.55 38.7 49.4 59.7 49.7 44.1 52.4 0.00 0.00 0.00 0.00 0.00 0.00
Results: Spatial clustering ACS Disability p < 0.01
Results: Spatial clustering, SSDI Disability p < 0.01
Results: Comparing Correlates of Disability Prevalence Across Data Sources Table 1. Lagged Spatial Regression [b(SE)] Disability Prevalence ACS -0.09 (0.01)*** SSDI -0.05*** Median HH Income % Unemployed 0.21 (0.02)*** 0.17*** % Public Assistance 0.13 (0.03)*** 0.20*** % High school diploma 0.11 (0.01)*** 0.02* R2 0.69 0.78 * p< 0.05; ** p< 0.01; *** p< 0.001
Results: Comparing Correlates of Disability Prevalence Across Disability Types Table 2. Lagged Spatial Regression [b(SE)] Disability Prevalence Independent -0.04 (0.01)*** 0.11 (0.01)*** 0.07 (0.02)*** 0.04 (0.00)*** Cognition -0.04 (0.00)*** 0.11 (0.01)*** 0.08 (0.02)*** 0.04 (0.01)*** Self-Care -0.02 (0.00)*** 0.06 (0.01)*** 0.02 (0.01) 0.02 (0.00)*** Hearing -0.02 (0.00)*** 0.01 (0.00) 0.02 (0.01) 0.03 (0.00)*** Mobility -0.06 (0.00)*** 0.14 (0.01)*** 0.07 (0.02)*** 0.07 (0.02)*** Vision -0.03 (0.00)*** 0.05 (0.00)*** 0.03 (0.01)* 0.00 (0.00 Living Median HH Income % Unemployed % Public Assistance % High school diploma R2 * p< 0.05; ** p< 0.01; *** p< 0.001 0.52 0.41 0.57 0.70 0.50 0.60
Results: Association between Disability Types and SSDI Disability Table 3. Lagged Spatial Regression [b(SE)] SSDI Disability Prevalence I II III IV V VI VII % Any ACS disability 0.21(0.00)*** -- -- -- -- -- -- % Vision -- 0.25(0.02)*** -- -- -- -- -- % Hearing -- -- 0.26(0.02)*** -- -- -- -- % Cognitive -- -- -- 0.32(0.01)*** -- -- -- % Mobility -- -- -- -- 0.32(0.01)*** -- -- % Self-care -- -- -- -- -- 0.48(0.02)*** -- % Independent living -- -- -- -- -- -- 0.41(0.01)*** R2 0.82 0.78 0.78 0.80 0.82 0.80 0.81 * p< 0.05; ** p< 0.01; *** p< 0.001 Adjusted for median household income, unemployment, public assistance, high school graduates
Summary Maps of disability prevalence showed similar geographic variation in ACS and SSDI disability prevalence. Spatial statistics demonstrated significant geographic clustering by both data sources and by disability type. Both SSDI and ACS showed significantly high disability clusters in Appalachia as well as parts of Missouri, Oklahoma, and Michigan. ACS showed additional high prevalence in parts of New Mexico. Low prevalence was significant in the New York metro-area, the California coast, and the Midwest and Mountain states. Indicators of low county level socioeconomic status were associated with higher disability prevalence across data sources and types.
Future Considerations Determine additional factors related to spatial variation in disability and disability types. Demographic & social Industrial mix Examine differences in spatial variation by region.
Questions? abotticello@kesslerfoundation.org Thank You!