Insights into Farmers Markets Growth and Shopper Trends
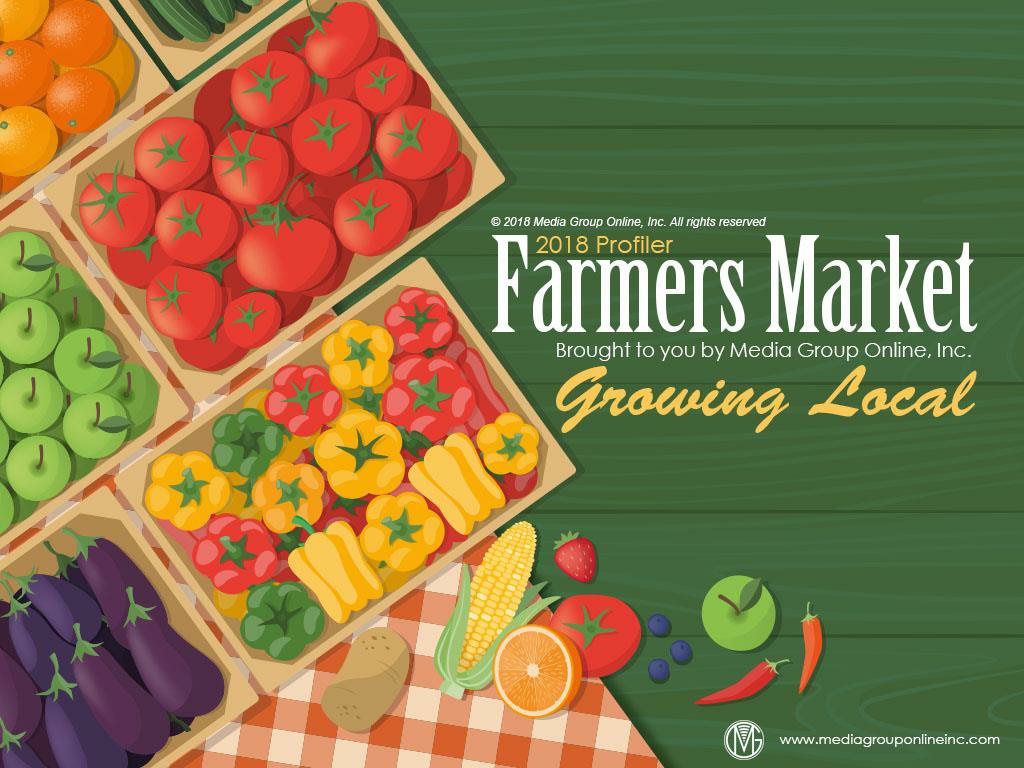
The US Department of Agriculture reported a rise in the number of farmers markets in 2017, with notable revenue increases. Farm-fresh product sales, shopper profiles, and local food expectations are detailed, reflecting a growing trend towards supporting local agriculture and community-based markets.

Download Presentation

Please find below an Image/Link to download the presentation.
The content on the website is provided AS IS for your information and personal use only. It may not be sold, licensed, or shared on other websites without obtaining consent from the author. Download presentation by click this link. If you encounter any issues during the download, it is possible that the publisher has removed the file from their server.
E N D
Presentation Transcript
The Same Number of Farmers Market Generated Much More Sales According to the US Department of Agriculture (USDA), there were 8,687 farmers markets in the US during 2017, an increase of 0.21%. During 2017, 41,156 farm organizations participated in farmers market and generated $711 million. Farms that participated in local food markets, which include farmers markets, community-supported agriculture (CSA), roadside stands and online sales, more than doubled their revenues, from 2016 s $1.3 billion to 2017 s $3.03 billion. Almost half (48%) of farmers markets are in the Northeast (9,914) and Southeast (9,966), followed by the Midwest (5,940), West (4,838), Central (4,411), South (4,246) and Northwest (1,841).
Buy Local Farmers markets are a major marketing channel for those farmers who sell locally. For 42% of them, farmers markets account for 100% of their direct-to-consumer sales; 12%, 75 99%; 15%, 50 74%; 16%, 25 49%; and 15%, less than 25%. Six in ten (61.36%) of farmers travel less than 20 miles to their most successful farmers market, with another 21.06% traveling 21 to 40 miles. Northeastern markets generated the most farmers market sales, or $208 million, 29% of the total. They also accounted for 44% of CSA and 36% of offsite store/stand revenues. Western farmers markets were second, at 22%.
Farm-Fresh Product Sales According to a survey from the Farmers Market Federation of New York, baked goods generated the most in daily sales at $1,467, followed by fruit, $1,113; vegetables, $905; bedding plants, $831; and dairy products, $805. Fresh-cut and dried flowers sales had the highest average sales, at $20; followed by honey products, $60; exotic meat, $15.50; and baked goods, $13. Lamb and goat meat had the lowest average sales, at $7, followed by eggs, at $8. New York farmers made, on average, $1,009 per market day, $2,522 per week and $65,585 per season, with expenses of $12,375, for a net income of $53,210. Markets typically charge farmers 6 8% of sales, although some have flat fees.
Farmers Market Shopper Profile A study published in June 2017 from researchers at the University of Tennessee found 63.9% of farmers market shoppers were female and 69.9% were Caucasian American; 12.8%, Asian American; 8.9%, Latino American; and 5.4%, African American. Shoppers skewed younger, with almost half (44.5%) age 34 and younger. Specifically, 17.9% were younger than 25; 26.6%, 25 34; 19.6%, 35 44, 17.7%; 45 54; 18.1%, 55 64; and none were 65 years or older. More than half of shoppers earned $25,000 $74,999 annually, with only 14% less than $25,000. Almost 15% earned $75,000 $99,999; 7.8%, $100,000 $124,999; 4.9%, $125,000 $149,999; and 8.2%, $150,000 or more.
What Shoppers Expect from Local Food Shoppers have different definitions of local food. More than a quarter said it is food grown within 10 miles of their residence; 24.7%, within 50 miles; and 13.4%, within 100 miles. Residents of small towns had a narrower definition than those in big cities. Although more than 60% expected local food to be organically grown, that is not always the case. More than half of respondents expected foods to have at least five of six of the following characteristics. These include produced by my neighbors, produced in a socially responsible manner, from community-supported agriculture associations (CSAs), environmentally safe, organically grown and produced and distributed in a sustainable way.
Advertising Strategies Especially in metropolitan statistical areas, target Latino American consumers with Spanish- language advertising. Feature African Americans and Latino Americans in addition to other races/ethnicities in advertising. To increase attendance and satisfy community goals, mention if your market accepts SNAP (aka food stamps) and any special programs or events you have to promote SNAP. Showcase any entertaining and interactive activities at your market, including cooking demonstrations, farmer presentations, kids arts and crafts, etc.
New Media Strategies Post videos on the market s Website and YouTube of farmers talking with customers about their farm and what and how they grow. Use social media so customers feel connected to their local farmers. After a particularly successful market with special events, invite customers to a booth with iPads where they can immediately post their reviews on Yelp and similar sites/apps. List your market on your city or county s Website, travel Websites and local neighborhood Websites. Test ad buys on these sites, if that option is available.