Portfolio Matrix: Strategic Product Positioning Guide
Learn about the Portfolio Matrix, a strategic tool assessing products based on industry growth and market share. Explore the BCG matrix, its four categories, and how it guides decision-making for products' future success.
Download Presentation
Please find below an Image/Link to download the presentation.
The content on the website is provided AS IS for your information and personal use only. It may not be sold, licensed, or shared on other websites without obtaining consent from the author. Download presentation by click this link. If you encounter any issues during the download, it is possible that the publisher has removed the file from their server.

Presentation Transcript
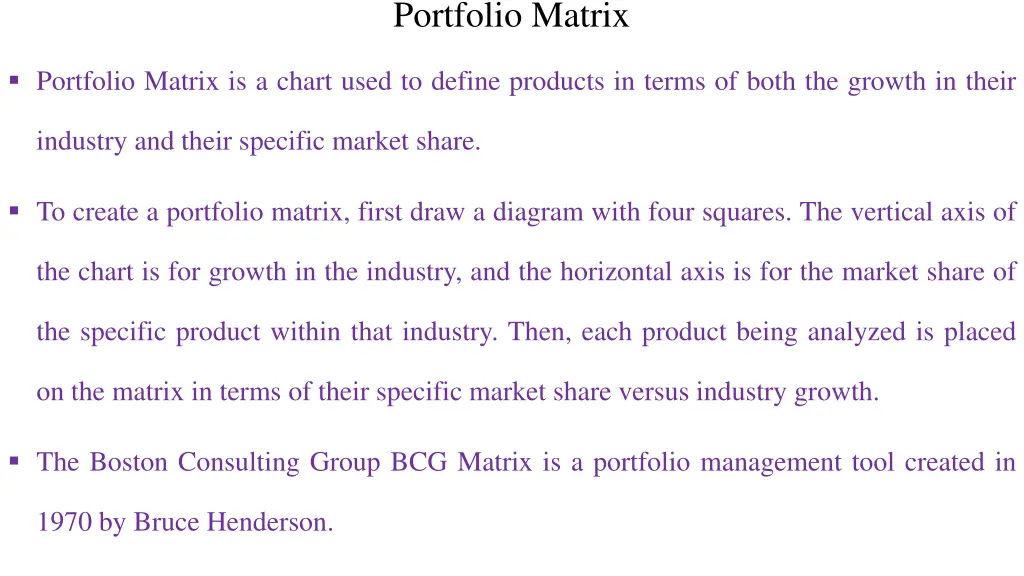
Portfolio Matrix Portfolio Matrix is a chart used to define products in terms of both the growth in their industry and their specific market share. To create a portfolio matrix, first draw a diagram with four squares. The vertical axis of the chart is for growth in the industry, and the horizontal axis is for the market share of the specific product within that industry. Then, each product being analyzed is placed on the matrix in terms of their specific market share versus industry growth. The Boston Consulting Group BCG Matrix is a portfolio management tool created in 1970 by Bruce Henderson.
It is also referred to as the BCG growth-share matrix. The Boston Consulting Group BCG Matrix is a simple corporate planning tool, to assess a company s position in terms of its product range. The BCG matrix has two dimensions: relative market share (indicating profitability, through economies of scale) and market growth rate (indicating market attractiveness). This BCG matrix shows the relationship between the products that are generating the cash and products eating the cash.
Four categories of BCG matrix The BCG growth-share matrix breaks down products into four categories: Question marks High Growth, Low Market Share (uncertainty) Dogs Low Growth, Low Market Share (less profitable) Stars High Growth, High Market Share (high competition) Cash cows Low Growth, High Market Share (most profitable)
Question Marks - (High Growth, Low Market Share) Question marks are products that grow rapidly and as a result, consume large amounts of cash, but because they have low market shares, they don t generate much cash. Question marks need to be analyzed carefully to determine if they are worth the investment required to grow market share. New assets enter the market as Question Marks. Examples: Mac Book Air of Apple, FUZE Healthy Infusions of Coca-Cola, tablet from Philips.
Stars (High Growth, High Market Share) It is business unit that has a large market share in a fast growing industry. It may generate cash but due to rapid growing market it requires investment to maintain its needs. These business units generally are in the growth stage of its product lifecycle and not self sufficient in terms of its financial needs. If a star can maintain its large market share it will become a cash cow when the market growth rate declines. Examples: iPhone ofApple, Vitamin Water of Coca-Cola, LED lamp from Philips
Cash Cow (Low Growth, High Market Share) This is a business unit with large market share in a mature and slow growing industry. Cash cow requires a little investment and generate cash that can be invested in other business units. These units should be milked extracting the profits and investing as little as possible. They provide the cash required to turn question marks into market leaders. Examples: iPods of Apple, Coca-Cola Classic of Coca-Cola, Philips energy-saving lamp, Procter and Gamble which manufactures Pampers nappies to Lynx deodorants.
Dogs (Low Growth, Low Market Share) These are business units with a small/ low market share in a mature industry and a low growth rate and neither generate nor consume a large amount of cash. However, dogs are cash traps because of the money tied up in a business that has little potential. Dog examples: New Coke of Coca-Cola, Plasma TV from Philips.
Four Strategies of BCG Matrix After measuring market share and market growth, business units can be plotted in the matrix. 4 Strategies of BCG Matrix Build Hold Harvest Divest
Build Increase market share by making further investments (for example, to maintain star status, or to turn a question mark into a star). Hold Maintain the status quo (do nothing). Harvest Reduce the investment (enjoy positive cash flow and maximize profits from a star or a cash cow). Divest For example, get rid of the dogs, and use the capital you receive to invest in stars and question marks.
When to use BCG Matrix ? The BCG matrix should be used as part of strategic portfolio management to manage cashflow (McDonald, 1999). The matrix enables you to determine which assets could produce future revenues and make investment decisions that ensure funds are allocated to the right assets. The tool can reveal portfolio weaknesses that may threaten a company s future cashflow. If a company is not developing many Question Marks, it needs to consider where income will come from in future.
Advantages of BCG Matrix It is simple to implement and easy to understand. Larger companies can use it for the seeking volume and experience effects. It predicts the future actions of a company. Hence, the company can decide its proper management strategy. Helpful for managers to evaluate balance in the firm s current portfolio of Stars, Cash Cows, Question Marks, and Dogs The matrix indicates that the profit of the company is directly related to its market share. Therefore, a company can increase market share if it seems profitable. It has only four categories that make it in simple form to operate efficiently.
Limitations of BCG Matrix The BCG Matrix produces a framework for allocating resources among different business units and makes it possible to compare many other business units. BCG matrix classifies businesses as low and high, but generally, businesses can be medium also. Thus, the true nature of the business may not be reflected. The distinction between high and low is highly subjective.
The use of BCG analysis cannot help managers take into account synergies that may possibly exist among the various SBUs within the product portfolio. The market is not clearly defined in this model. The problems of getting data on the market share and market growth.


")
")
")
")