Understanding Student Engagement in Higher Education
Exploring the concept of student engagement in higher education, this presentation template provides a comprehensive overview of key principles, including what student engagement entails and how institutions can promote it effectively. It covers NSSE, BCSSE, and FSSE results, offering user resources, data utilization strategies, and engaging in discussions on the topic.

Download Presentation

Please find below an Image/Link to download the presentation.
The content on the website is provided AS IS for your information and personal use only. It may not be sold, licensed, or shared on other websites without obtaining consent from the author. Download presentation by click this link. If you encounter any issues during the download, it is possible that the publisher has removed the file from their server.
E N D
Presentation Transcript
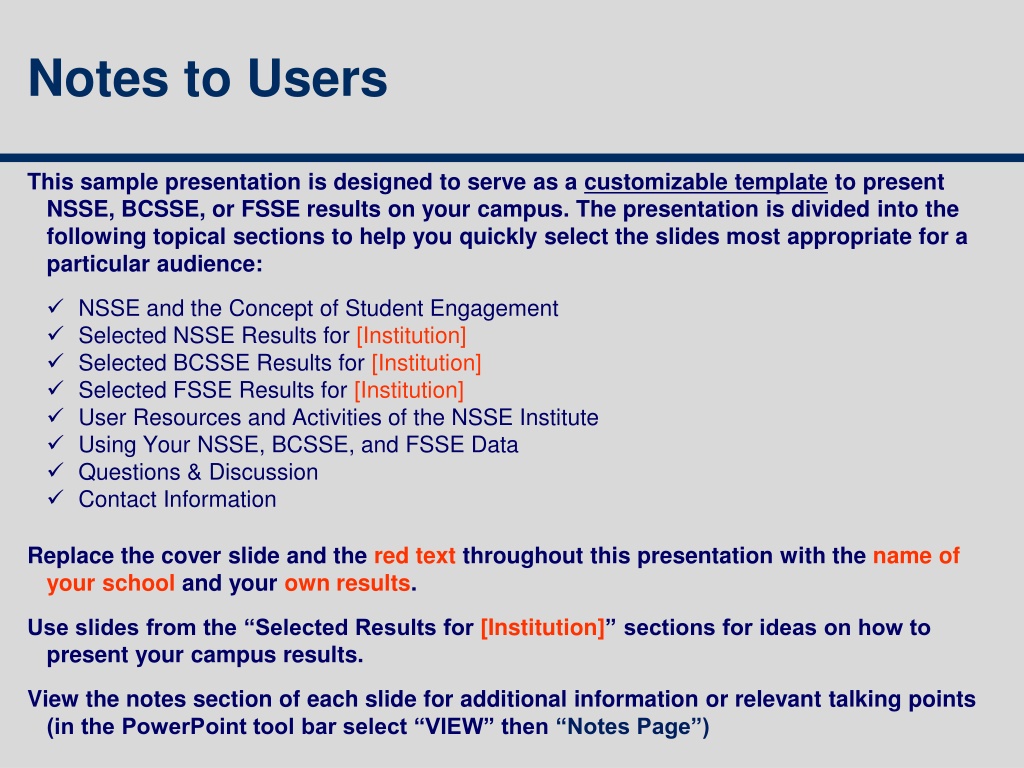
Notes to Users This sample presentation is designed to serve as a customizable template to present NSSE, BCSSE, or FSSE results on your campus. The presentation is divided into the following topical sections to help you quickly select the slides most appropriate for a particular audience: NSSE and the Concept of Student Engagement Selected NSSE Results for [Institution] Selected BCSSE Results for [Institution] Selected FSSE Results for [Institution] User Resources and Activities of the NSSE Institute Using Your NSSE, BCSSE, and FSSE Data Questions & Discussion Contact Information Replace the cover slide and the red text throughout this presentation with the name of your school and your own results. Use slides from the Selected Results for [Institution] sections for ideas on how to present your campus results. View the notes section of each slide for additional information or relevant talking points (in the PowerPoint tool bar select VIEW then Notes Page )
Insert Presenter Name(s) Here Insert Presentation Date
Presentation Overview 1. NSSE and the Concept of Student Engagement 2. Selected NSSE Results for [Institution] 3. Selected BCSSE Results for [Institution] 4. Selected FSSE Results for [Institution] 5. User Resources 6. Using Your NSSE, BCSSE, and FSSE Data 7. Questions & Discussion 8. Contact Information
NSSE and the Concept of Student Engagement
What is Student Engagement? What students do Time and energy devoted to studies and other educationally purposeful activities What institutions do Using resources and effective educational practices to induce students to do the right things Educationally effective institutions channel student energy toward the right activities
Seven Principles of Good Practice in Undergraduate Education Student-faculty contact Active learning Prompt feedback Time on task High expectations Experiences with diversity Cooperation among students Chickering, A. W. & Gamson, Z. F. (1987). Seven principles for good practice in undergraduate education. AAHE: Bulletin, 39 (7), 3-7.
Other Supporting Literature Traces the development of student engagement as a research-informed intervention to shift the discourse on quality in higher education to emphasize matters of teaching and learning while providing colleges and universities with diagnostic, actionable information that can inform improvement efforts. McCormick, A. C., Kinzie, J., & Gonyea, R. M. (2013). Student engagement: Bridging research and practice to improve the quality of undergraduate education. In M. B. Paulsen (Ed.), Higher education: Handbook of theory and research (pp 47-92), Vol. 28. Springer Netherlands. After a review of thousands of studies on college students from 1970 through the 1990s, Ernest Pascarella and Patrick Terenzini concluded student engagement is a central component of student learning. The Volume 3 update (Mayhew et. al, 2016) adds further evidence Pascarella, E. & Terenzini, P (2005). How college affects students: A third decade of research. San Francisco: Jossey-Bass Publishers. Mayhew, M. et al., (2016). How college affects students: 21st century evidence that higher education works. San Francisco: Jossey-Bass Publishers. Presents institutional policies, programs, and practices that promote student success. Provides practical guidance on implementation of effective institutional practice in a variety of contexts. Kuh, G. D., Kinzie, J., Schuh, J. H., Whitt, E.J., & Associates (2005/2010). Student success in college: Creating conditions that matter. San Francisco: Jossey-Bass.
NSSE Background Launched with grant from The Pew Charitable Trusts in 1999, supported by institutional participation fees since 2002. Nearly 1700 baccalaureate- granting colleges and universities in the US and Canada have participated to date. Institution types, sizes, and locations represented in NSSE are largely representative of U.S. baccalaureate institutions. Year Institutions 2001 thru 2015 1600 2016 557 2017 722 2018 505 2019 531 2020 601 2021 356
Goals of NSSE Project Focus conversations on undergraduate quality Enhance institutional practice and improvement initiatives Foster comparative and consortium activity Provide systematic national data on effective educational practices
NSSE Survey Content Engagement in meaningful academic experiences Engagement in High-Impact Practices Student learning & development Student reactions to college Student background information
NSSE Engagement Indicators Engagement Indicators Engagement Themes Academic Challenge Learning with Peers Experiences with Faculty Student Faculty Interaction Campus Environment
Survey Administration Census-administered or randomly sampled first-year students & seniors Mobile-optimized survey Spring administration Multiple follow-ups to increase response rates Topical Modules provide option to delve deeper into the student experience Consortium participation enables addition of custom questions
A Commitment to Data Quality NSSE s Psychometric Portfolio presents evidence of validity, reliability, and other indicators of data quality. It serves higher education leaders, researchers, and professionals who use NSSE. See the Psychometric Portfolio nsse.indiana.edu/nsse/psychometric-portfolio
Selected NSSE Results for [Institution]
NSSE 2021 Institutions by Carnegie Classification 100% NSSE Schools 75% All Bachelor's Degree-Granting Schools 50% 24% 22% 25% 17% 13% 15% 13% 12% 12% 12% 12% 8% 8% 8% 9% 6% 8% 0% Bac/Diverse Doc/High Master's M Master's S Master's L Doc/Very High Bac/A&S Doc/Professional
NSSE 2021 Percentage Respondents by Race, Ethnicity, and Nationality U.S. Bachelor s- Granting Population NSSE 2021 Respondents Race/Ethnicity 10 12 African American/Black <1 1 American Indian/Alaska Native 6 7 Asian <1 <1 Native Hawaiian/other Pacific Islander 62 54 Caucasian/White 15 17 Hispanic/Latino 4 4 Multiracial/multiethnic 3 5 Foreign/nonresident alien
NSSE 2021 Survey Population and Respondents Approximately 890,000 students were invited to participate in NSSE 2021, with 211,667 responding. x [Institution] students were invited to participate, with x responding.
NSSE 2021 U.S. Institution Response Rates [Your institution s] response rate = x% All US NSSE 2021 institutions = 30% Response Rates by Enrollment: NSSE 2021 U.S. Average Institutional Undergraduate Enrollment 2,500 or fewer 2,501 to 4,999 5,000 to 9,999 10,000 or more All institutions 2020 36 28 25 23 30 2021 35 30 24 22 30
NSSE 2021 Results (Sample Slides) The following slides are examples of how your institution might share selected NSSE results with various institutional constituencies. Expand this section to highlight items of interest to your audience.
Overall results compared to peer group for each Engagement Indicator
Highest and lowest performing items compared to peer group (FY)
Highest and lowest performing items compared to peer group (SR)
Engagement Indicator: Quality of Interactions Indicate the quality of your interactions with the following people at your institution. (First-year students) 100% Faculty Advisor 75% 50% 28% 25% 27% 25% 23% 25% 19% 16% 15% 5% 7% 3% 2% 2% 2% 0% Poor 2 3 4 5 6 Excellent
Engagement Indicator: Discussions with Diverse Others How often have you had discussions with people from the following groups? (First-year students) 100% People of a race or ethnicity other than your own People with religious beliefs other than than your own 75% 50% 40% 39% 37% 32% 25% 23% 25% 3% 1% 0% Never Sometimes Often Very often
High Impact Practices (FY) Percentage of first-year students who participated in a learning community and in course-based service-learning. 100% First-Year Students Selected Peers 75% 61% 50% 41% 25% 10% 6% 0% Learning Community Service-Learning
Engagement Indicators: LS and CL (First-Year Students) Learning Strategies and Collaborative Learning (First-Year Students) 60 First-Year Students Selected Peers 45 40.8 38.5 37.4 32.4 30 15 0 Learning Strategies Collaborative Learning
High Impact Practices (SR) Percentage of seniors who worked on a research project with a faculty member, and who did a culminating senior experience. 100% Seniors Selected Peers 84% 75% 61% 54% 50% 24% 25% 0% Work w/Faculty on Research Project Culminating Senior Experience
Engagement Indicators: HO and SF (Seniors) Higher-Order Learning and Student-Faculty Interaction (Seniors) 60 Seniors Selected Peers 45 40.6 39.7 30.9 30 25.6 15 0 Higher-Order Learning Student-Faculty Interaction
How do students spend their time? Preparing for Class Percentage spending more than 10 hours per week preparing for class Class [Institution] Selected Peers First-Year More than x% More than x% Senior More than x% More than x%
How do students spend their time? Co-Curricular Activities Percentage of students spending more than 5 hours per week participating in co-curricular activities Class [Institution] Selected Peers First-Year More than x% More than x% Senior More than x% More than x%
Selected BCSSE Results for [Institution]
BCSSE Purpose BCSSE has common content for all students regarding their academic expectations and perceptions for the coming year. There are also BCSSE questions specific to first-year, transfer, and older students. These targeted questions provide a more in-depth understanding of each of these unique groups of students.
BCSSE Survey Content There are three sections to the BCSSE survey: 1. Prior educational experiences 2. Expectations and beliefs regarding the upcoming college year 3. Background characteristics
Administration Modes Paper, Web, or Mixed Modes Paper group administration (FY only) Orientation, Welcome Week, etc. Web group administration While students are in computer lab, etc. Web email administration Web link emailed to students
BCSSE: Expectations for the First Year of College
BCSSE-NSSE Many of these questions are designed to be paired with NSSE, providing an in-depth view of the first-year experience. BCSSE NSSE
BCSSE Scales Corresponding NSSE Engagement Indicator * * * * * BCSSE Scales High School Quantitative Reasoning High School Learning Strategies Transfer Student Learning Strategies (Transfer student only) Expected Student-Faculty Interactions Expected Collaborative Learning Expected Discussions with Diverse Others Importance of Campus Environment Expected Academic Perseverance Expected Academic Difficulty Expected Academic Help-Seeking Perceived Academic Preparation * Items in these three BCSSE scales also correspond to NSSE s First-Year Experience Module ** Items in this BCSSE scale also correspond to NSSE s personal gains items
BCSSE Reports Four reports are provided: BCSSE Institutional Report (Summer/Fall 2020) BCSSE Student Advising Report (Summer/Fall 2020) Grand Frequencies and Means (Fall 2020) Overall Institution types BCSSE-NSSE Combined Report (Summer 2021)
During Last Year of High School About how many hours preparing for class (studying, doing homework, rehearsing, etc.) 100% A- or higher B+ or lower 73% 75% 62% 50% 28% 21% 25% 7% 4% 3% 2% 1% 1% 0% 0 Hours 1-10 11-20 21-30 More than 30
During the coming school year, how difficult do you expect the following to be? Learning course material 100% First-generation Not first-generation 75% 50% 41% 39% 25% 22% 22% 25% 19% 8% 8% 7% 6% 2% 1% 0% Not at all difficult 2 3 4 5 Very difficult
BCSSE 2019-NSSE 20 Combined Results for [Institution] Results by Expectations and Whether Expectations Were Met
Selected FSSE Results for [Institution]
Faculty Survey of Student Engagement (FSSE is pronounced fessie ) College faculty survey that measures faculty expectations for student engagement in educational practices that are empirically linked with student learning and development
FSSE Survey Content How often faculty use effective teaching practices The importance faculty place on increasing institutional support for students How much faculty encourage students to collaborate The importance faculty place on various areas of learning and development The nature and frequency of faculty-student interactions How faculty members organize their time, both in and out of the classroom Opportunities to engage in diverse perspectives
FSSE 2021 Project Scope In 2021, more than 9,000 faculty members from 75 institutions responded to the survey. In 2021, 31% of the faculty contacted responded to the survey. Response rates at individual institutions ranged from 11% to 75%. The average institutional response rate was 39%.
FSSE Administration Third-party administration in the spring Institutions choose faculty to be surveyed Faculty responses are kept anonymous Administered as an online-only survey Institutions are able to add topical modules and consortium items to the end of the core FSSE instrument
Faculty Values and Student Participation in High-Impact Practices Faculty- Very Important or Important First-Year Participation Senior Participation Intentionally left blank [Institution] [Institution] [Institution] FSSE NSSE NSSE High-Impact Practice 42% 83% Internship --- 20% 54% Learning Community 9% 10% 36% Study Abroad --- 20% 57% Research with Faculty 4% 42% 85% Culminating Senior Experience --- 58% 64% Service-Learning 45%
Contact Information [Institution] Center for Postsecondary Research Indiana University School of Education 201 North Rose Avenue Bloomington, IN 47405-1006 NSSE Contact: [Contact name] [Contact email address] Phone: 812-856-5824 Fax: 812-856-5150 Email: nsse@indiana.edu Web: nsse.indiana.edu Twitter: @NSSEsurvey, @NSSEinstitute Blog: NSSEsightings.Indiana.edu .

 Here")


")


")

")