Comprehensive Overview of FFP Annual Monitoring Indicators
Delve into the significance of annual monitoring, different categories and types of indicators, and the indicator revision process for the Food for Peace (FFP) program. Explore how to collect data, understand required indicators, and distinguish between output and outcome indicators.
Download Presentation

Please find below an Image/Link to download the presentation.
The content on the website is provided AS IS for your information and personal use only. It may not be sold, licensed, or shared on other websites without obtaining consent from the author. Download presentation by click this link. If you encounter any issues during the download, it is possible that the publisher has removed the file from their server.
E N D
Presentation Transcript
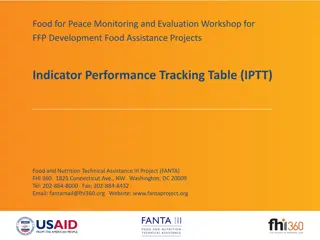
Food for Peace Monitoring and Evaluation Workshop for FFP Development Food Assistance Projects FFP Annual Monitoring Indicators Food and Nutrition Technical Assistance III Project (FANTA) FHI 360 1825 Connecticut Ave., NW Washington, DC 20009 Tel: 202-884-8000 Fax: 202-884-8432 Email: fantamail@fhi360.org Website: www.fantaproject.org
Session Objectives Understand: 1. The importance of annual monitoring 2. The different categories of annual monitoring indicators 3. Which indicators are applicable to your program 4. How data can be collected for the indicators FFP Annual Monitoring Indicators
PART 1 OF 2 Introduction to the FFP Annual Monitoring Indicators FFP Annual Monitoring Indicators
Indicator Revision Process More standardized and quantifiable More aligned with Feed the Future (FTF) and State Department (F) indicators Updated Food for Peace (FFP) indicator list New FFP program-specific indicators introduced FFP Annual Monitoring Indicators
Indicator Categories CATEGORY Agriculture and Livelihoods Maternal and Child Health and Nutrition (MCHN) Resilience Gender TOTAL FFP Annual Monitoring Indicators
Output Versus Outcome Indicators TOTAL NUMBER Output Outcome 16 16 TOTAL 32 FFP Annual Monitoring Indicators
Indicator Types TOTAL NUMBER 2 30 TYPE Required (R) Required if Applicable (RiA) Total of 32 annual monitoring indicators FFP Annual Monitoring Indicators
Required (R) Indicators Required for all development programs FFP Annual Monitoring Indicators
Required (R) Indicators 1. Number of vulnerable households benefiting directly from USG assistance 2. Proportion of female participants in USG-assisted programs designed to increase access to productive economic resources (assets, credit, income, or employment) FFP Annual Monitoring Indicators
Required if Applicable (RiA) Indicators Required if applicable for all development programs that have relevant interventions FFP Annual Monitoring Indicators
RiA: When Are They Applicable? Read applicability criteria Ask yourself: Should we collect this indicator? FFP Annual Monitoring Indicators
Example of an RiA Indicator Are you working on value chains? Example: Gross margin per hectare, animal or cage of selected product FFP Annual Monitoring Indicators
RiA: Another Example of Applicability Are you increasing access to credit? Example: Value of agricultural and rural loans FFP Annual Monitoring Indicators
Where to Find Guidance 1. Revised Food for Peace (FFP) Indicator Handbook (forthcoming early 2015) 2. Feed the Future (FTF) Indicator Handbook: Definition Sheets 3. FFP Annual Indicator Performance Indicator Reference Sheets (PIRS) 4. State Department (F) Performance Indicator Reference Sheets (PIRS) 5. Feed the Future (FTF) Agricultural Indicators Guide* 6. FFP and FTF Beneficiary-Based Survey Guide* (forthcoming Q4 2014) * Covers only four challenging agricultural indicators FFP Annual Monitoring Indicators
PART 2 OF 2 Data Collection for the FFP Annual Monitoring Indicators FFP Annual Monitoring Indicators
Whos Responsible? Data collection for annual monitoring indicators is the responsibility of the Awardees FFP Annual Monitoring Indicators
Four Challenging Agriculture Indicators 1. 2. Value of incremental sales (collected at farm level) attributed to USG implementation 3. Number of hectares under improved technologies or management practices as a result of USG assistance 4. Number of farmers and others who have applied improved technologies or management practices as a result of USG assistance Gross margin per hectare, animal or cage of selected product All four indicators are RiA All four indicators are for agriculture program components FFP Annual Monitoring Indicators
Why Challenging? Five components of gross margin Complex Incremental sales compares two years with different number of beneficiaries in each year Changes in beneficiary base Measuring hectares through farmer recall or farmer estimation is unreliable Measurement challenges FFP Annual Monitoring Indicators
Decision Process How to collect data for the fourchallenging FFP indicators (if applicable to program) DECISION #1 DECISION #2 How to collect data for the remaining FFP indicators FFP Annual Monitoring Indicators
Decision #1 How to collect data for the four challenging FFP annual monitoring indicators FFP Annual Monitoring Indicators
Four Challenging FFP Indicators: Impact on Data Collection The four challenging indicators require special consideration during data collection FFP Annual Monitoring Indicators
Four Challenging FFP Indicators: Methods of Data Collection How to collect data for the four challenging annual monitoring indicators: 1. 2. Routine monitoring Beneficiary-based survey FFP Annual Monitoring Indicators
Four Challenging FFP Indicators: Two Data Collection Options Routine monitoring Beneficiary-based survey Infrequent activity Stand-alone activity External technical expertise needed (usually) Continual process Part of routine program activities (often the case for FFP projects) Managed by internal program staff FFP Annual Monitoring Indicators
Four Challenging FFP Indicators: Advantages and Disadvantages Data quality Difficulty to implement Time Resources Routine monitoring Beneficiary- based survey FFP Annual Monitoring Indicators
Four Challenging FFP Indicators: Recommendation Use routine monitoring (whenever possible)! FFP Annual Monitoring Indicators
Four Challenging FFP Indicators: When to Consider Beneficiary-Based Surveys? 1. Appropriate scenario 2. Sufficient resources 3. Sufficient time FFP Annual Monitoring Indicators
Four Challenging FFP Indicators: Appropriate Scenarios for Beneficiary-Based Surveys Difficult to achieve ideal of visiting all beneficiaries with routine monitoring Large program size Farmer recall/estimation is considered unreliable; direct measurement is preferred Example: measuring hectares Example: contact with outside agricultural organizations under a market facilitation approach Lack of direct contact between program and beneficiaries FFP Annual Monitoring Indicators
Four Challenging FFP Indicators: Sufficient Resources for Beneficiary-Based Surveys SOLVE FOR NUMBER OF STAFF REQUIRED SOLVE FOR NUMBER OF DAYS REQUIRED Please fill in all cells in yellow. Please fill in all cells in yellow. SURVEY INFORMATION Sample size Days of data collection Interviews per day (rounded up) SURVEY INFORMATION Sample size Data collectors Interviews per data collector per day Interviews per day 255 255 20 13 10 2 20 DATA COLLECTORS Interviews per data collector per day Data collectors 2 7 Days of data collection (rounded up) 13 FIELD TEAMS Data collectors per team Teams (rounded to nearest integer) Supervisors per team Field data entry per team Drivers per team Other staff per team - 3 2 1 1 1 FIELD STAFF Data collectors Supervisors Field data entry Drivers Other staff TOTAL FIELD STAFF - 7 2 2 2 13 HEADQUARTERS STAFF Survey manager Data entry Other staff TOTAL HEADQUARTERS STAFF - 1 2 3 TOTAL STAFF 16
Four Challenging FFP Indicators: Sufficient Time for Beneficiary-Based Surveys Estimated number of days Task # Task description 1 2 3 4 5 6 7 8 9 10 11 12 13 Develop and finalize sampling plan (sample size calculation, development of sampling frame, survey design) 1 10 days Develop and translate draft survey instrument(s) (in relevant local languages) 2 10 days Develop, translate and finalize survey training agenda and materials (in English and in relevant local languages) Concurrent with data collection instruments 3 4 Recruit data collectors 30 days Train data collectors, and pre-test and finalize survey instrument(s) 5 10 days 6 Data collection 15-20 days Clean and analyze collected survey data 7 10 days Prepare and present final results 8 5 days
Four Challenging FFP Indicators: There Is No One Survey Type Within the option of beneficiary- based survey, there are several different possible approaches. FFP Annual Monitoring Indicators
Four Challenging FFP Indicators: Different Survey Approaches
Four Challenging FFP Indicators: Resources to Help Decide Feed the Future (FTF) Agricultural Indicators Guide (September 2013) Definitions What data to collect Food for Peace (FFP)/ Feed the Future (FTF) Beneficiary-Based Survey Guide (forthcoming Q4 2014) How to collect data How to analyze data FFP Annual Monitoring Indicators
Decision Process DECISION #1 How to collect data for the fourchallenging FFP indicators (if applicable) DECISION #2 How to collect data for the remaining FFP indicators FFP Annual Monitoring Indicators
Decision #2 How to collect data for the remaining FFP annual monitoring indicators FFP Annual Monitoring Indicators
Remaining FFP Indicators: How to Categorize Remaining Indicators 1. Indicators related to entities: private enterprises, stakeholders, loans, MSMEs, and communities/villages 2. Indicators related to infrastructure 3. Indicators related to MCHN FFP Annual Monitoring Indicators
Remaining FFP Indicators: Indicators Related to Entities Indicators related to entities (private enterprises, stakeholders, loans, MSMEs, and communities/villages): Several indicators (e.g., number of food security private enterprises (for profit), producers organizations, water users associations, women's groups, trade and business associations, and community-based organizations receiving USG assistance) FFP Annual Monitoring Indicators
Remaining FFP Indicators: Indicators Related to Entities Can collect data through direct contact with the entities or Can collect data via site observation (for a few of the indicators only) How this is done will vary by program Will usually need a mechanism that is separate from the program monitoring system FFP Annual Monitoring Indicators
Remaining FFP Indicators: Indicators Related to Infrastructure Three indicators: 1. Total increase in installed storage capacity (m3) 2. Kilometers of roads improved or constructed 3. Number of market infrastructures rehabilitated and/or constructed Can collect data through program records FFP Annual Monitoring Indicators
Remaining FFP Indicators: Indicators Related to MCHN Indicators Can collect data through direct contact using community health volunteers or outreach workers via routine monitoring OR Can collect data through direct contact via beneficiary-based surveys Note: Health Clinics do not tend to distinguish program beneficiaries from non-beneficiaries, so not recommended to collect data from HCs FFP Annual Monitoring Indicators
All Indicators: Overall Recommendations In most cases, you will need a combination of data collection activities, occurring at different times. FFP Annual Monitoring Indicators
All Indicators: Overall Recommendations No simple answer that works across all programs Spend time during program design to figure out what is best for your program FFP Annual Monitoring Indicators
All Indicators: Overall Recommendations If considering a survey, remember... Surveys are resource-intensive and require specialized technical expertise! Make sure sufficient money in budget before deciding to use a beneficiary-based survey and expect to use external contractors Best to use routine monitoring whenever possible instead FFP Annual Monitoring Indicators
References Food for Peace (FFP) Indicator Handbook (forthcoming early 2015) Feed the Future (FTF) Indicator Handbook: Definition Sheets http://feedthefuture.gov/sites/default/files/resource/files/ftf_handbook_indicato rs_sept2013_2_0.pdf FFP Annual Indicator Performance Indicator Reference Sheets (PIRS) http://www.usaid.gov/sites/default/files/documents/1866/PIRS%20for%20FFP%2 0Indicators.pdf State Department (F) Performance Indicator Reference Sheets (PIRS) http://www.state.gov/documents/organization/101764.pdf http://www.state.gov/documents/organization/101765.pdf Feed the Future (FTF) Agricultural Indicators Guide http://www.fsnnetwork.org/sites/default/files/ftf_agriculture_guide_0.pdf FFP and FTF Beneficiary-Based Survey Guide (forthcoming Q4 2014) FFP Annual Monitoring Indicators
This presentation is made possible by the generous support of the American people through the support of the Office of Health, Infectious Diseases and Nutrition, Bureau for Global Health, United States Agency for International Development (USAID); and the Office of Food for Peace, Bureau for Democracy, Conflict and Humanitarian Assistance, United States Agency for International Development (USAID), under terms of Cooperative Agreement No. AID-OAA-A-12- 00005, through the Food and Nutrition Technical Assistance III Project (FANTA), managed by FHI 360. The contents are the responsibility of FHI 360 and do not necessarily reflect the views of USAID or the United States Government. FFP Annual Monitoring Indicators
