Benchmark Process in Chemical and Biological Engineering Research Group
The benchmark process conducted by the Maravelias Research Group in Chemical and Biological Engineering focuses on wastewater treatment efficiency and performance metrics. The process includes various stages such as secondary treatment, preliminary treatment, primary treatment, disinfection, and biogas production through anaerobic digestion. The design and performance metrics indicate high removal efficiencies for BOD5 and TSS, along with details on pollutant concentrations and mass balance. The study emphasizes the use of innovative technologies in conventional wastewater treatment plants to achieve effective treatment outcomes.
- Engineering Research
- Wastewater Treatment
- Performance Metrics
- Biogas Production
- Environmental Engineering
Download Presentation

Please find below an Image/Link to download the presentation.
The content on the website is provided AS IS for your information and personal use only. It may not be sold, licensed, or shared on other websites without obtaining consent from the author. Download presentation by click this link. If you encounter any issues during the download, it is possible that the publisher has removed the file from their server.
E N D
Presentation Transcript
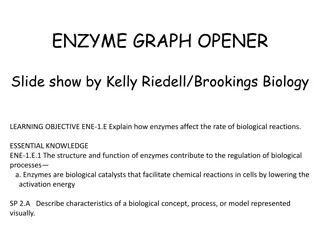
Benchmark process January 21, 2022 Maravelias Research Group Chemical and Biological Engineering
Benchmark Introduction S11 Chlorine S12 Treated water S1 Waste water Secondary treatment (Activated sludge and clarifier) Preliminary treatment (Grit) Primary treatment (Clarifier) Pumping station S2 S3 S5 S7 S9 Disinfection (Chlorination) S6 S8 Air S21 S4 S10 Grit/screenings to landfill Other buildings (Control, laboratory, etc.) Conventional wastewater treatment plant with activated sludge process Gravity thickening S14 S20 S13 S18 Lime and polymer S16 S19 Biosolids S15 Biogas# Anaerobic digestion Dewatering (Filter press) S17 Boiler Reference 1) Qasim, Syed R. Wastewater treatment plants: planning, design, and operation . (1985). BOD5: Biochemical oxygen demand TSS: Total suspended solids 2
Benchmark Design and performance S11 Chlorine BOD5 removal: 34% TSS removal: 63% BOD5 removal: 89% TSS removal: 85% S12 Treated water S1 Waste water Secondary treatment (Activated sludge and clarifier) Preliminary treatment (Grit) Primary treatment (Clarifier) Pumping station S2 S3 S5 S7 S9 Disinfection (Chlorination) 0.25 0.26 0.2 0.2 S6 S8 Air S21 S4 S10 Grit/screenings to landfill Other buildings (Control, laboratory, etc.) Plant Capacity: 38016 m3/d Removal efficiency BOD5: 92.0%; TSS: 92.3% Biogas production Digestion period: 15 d Potential biogas production : 0.37 m3/kg TSS # 84% of produced biogas is used to supply heating energy for anaerobic digestion. Gravity thickening S14 S20 S13 S18 Lime and polymer Units S16 BOD5 [kg/m3] TSS [kg/m3] Biogas production : 0.37 m3/kg TSS S19 Biosolids S15 Biogas# Anaerobic digestion Dewatering (Filter press) S17 Boiler Reference 1) Qasim, Syed R. Wastewater treatment plants: planning, design, and operation . (1985). BOD5: Biochemical oxygen demand TSS: Total suspended solids 3
Benchmark Pollutant concentrations S11 Chlorine BOD5 removal: 34% TSS removal: 63% BOD5 removal: 89% TSS removal: 85% 190 S12 Treated water S1 Waste water Secondary treatment (Activated sludge and clarifier) Preliminary treatment (Grit) Primary treatment (Clarifier) Pumping station S2 S3 S5 S7 S9 Disinfection (Chlorination) 38016 0.250 0.260 38016 0.250 0.260 38016 0.250 0.260 37882 0.166 0.097 38511 0.185 0.137 38000 0.020 0.020 38000 0.020 0.020 S6 134 S8 Air 853125 S21 629 1.362 2.579 S4 S10 510 2.359 3.747 Grit/screenings to landfill 0.7 24.112 46.470 Other buildings (Control, laboratory, etc.) Gravity thickening S14 532 1.250 2.295 S20 66 1.500 4.182 S13 112 S18 Lime and polymer 286 Units S16 31 67.125 61.759 3.000 4.032 Volume flow [m3/d] BOD5 [kg/m3] TSS [kg/m3] Biogas production : 0.37 m3/kg TSS S19 Biosolids S15 Biogas# Anaerobic digestion Dewatering (Filter press) S17 15 419 75.867 272.667 81 15.272 50.370 2141 Boiler Reference 1) Qasim, Syed R. Wastewater treatment plants: planning, design, and operation . (1985). BOD5: Biochemical oxygen demand TSS: Total suspended solids 4
Benchmark Mass balance S11 Chlorine BOD5 removal: 34% TSS removal: 63% BOD5 removal: 89% TSS removal: 85% 190 S12 Treated water S1 Waste water Secondary treatment (Activated sludge and clarifier) Preliminary treatment (Grit) Primary treatment (Clarifier) Pumping station S2 S3 S5 S7 S9 Disinfection (Chlorination) 38016 9504 9884 38016 9504 9884 38016 9504 9884 37882 6273 3657 38511 7130 5279 38000 760 760 38000 760 760 S6 134 3231 6227 S8 Air 853125 S21 629 857 1622 S4 S10 510 1203 1911 Grit/screenings to landfill 0.7 Other buildings (Control, laboratory, etc.) Water recovery: >99% Biogas production#: 419 m3/d Initial production: 2560 m3/d Combustion for heat supply: 2141 m3/d Gravity thickening S14 532 665 1221 S20 66 99 276 S13 112 7518 6917 S18 Lime and polymer 286 Units S16 31 93 125 Volume flow [m3/d] Chemical mass flow [kg/d] BOD5 mass flow [kg/d] TSS mass flow [kg/d] Biogas production : 0.37 m3/kg TSS S19 Biosolids S15 Biogas# Anaerobic digestion Dewatering (Filter press) S17 15 419 1138 4090 81 1237 4080 2141 Boiler Reference 1) Qasim, Syed R. Wastewater treatment plants: planning, design, and operation . (1985). BOD5: Biochemical oxygen demand TSS: Total suspended solids 5
Reference 2) Pabi, S., et al. "Electricity use and management in the municipal water supply and wastewater industries." (2013). Benchmark Energy requirements S11 Chlorine 190 2200 280 300 7900 S12 Treated water S1 Waste water Secondary treatment (Activated sludge and clarifier) Preliminary treatment (Grit) Primary treatment (Clarifier) Pumping station S2 S3 S5 S7 S9 Disinfection (Chlorination) 38016 9504 9884 38016 9504 9884 38016 9504 9884 37882 6273 3657 38511 7130 5279 38000 760 760 38000 760 760 46 S6 134 3231 6227 S8 Air 853125 S21 629 857 1622 S4 S10 510 1203 1911 Grit/screenings to landfill 0.7 Other buildings (Control, laboratory, etc.) 2520 0.390 Gravity thickening 14 Treated water S14 532 665 1221 1.00 S20 66 99 276 1.00 Wastewater treatment S13 112 7518 6917 S18 Lime and polymer 286 Units S16 Waste water 31 0.011 Biogas 93 125 Volume flow [m3/d] Chemical mass flow [kg/d] BOD5 mass flow [kg/d] TSS mass flow [kg/d] 1100 0.056 S19 Biosolids 0.285 S15 Biogas# Anaerobic digestion Dewatering (Filter press) Boiler S17 Electricity [kWh/d] Heat [kWh/d] 15 419 1138 4090 81 1237 4080 10840 460 Electricity [kWh/(m3/d)] Biogas [m3/d] Water [m3/d] 2141 Boiler BOD5: Biochemical oxygen demand TSS: Total suspended solids Heat [kWh/(m3/d)] 6
Reference 3) EPA. Construction Costs for Municipal Wastewater Treatment Plants: 1973-1978 ." (1980). 4) EPA, Costs and Manpower for Municipal Wastewater Treatment Plant Operation and Maintenance, 1965-1968 (1978) Benchmark Treatment costs S11 Chlorine 190 2200 280 300 7900 S12 Treated water S1 Waste water Pumping station 0.048 (0.037/0.011) Preliminary treatment 0.028 (0.025/0.004) Primary treatment 0.046 (0.040/0.006) Secondary Treatment 0.233 (0.193/0.040) Disinfection 0.023 (0.019/0.004) S2 S3 S5 S7 S9 38016 9504 9884 38016 9504 9884 38016 9504 9884 37882 6273 3657 38511 7130 5279 38000 760 760 38000 760 760 46 S6 134 3231 6227 S8 Air 853125 S21 629 857 1622 S4 S10 510 1203 1911 Grit/screenings to landfill 0.7 Other buildings 0.065 (0.052/0.013) Gravity thickening 0.026 (0.023/0.003) 2520 14 Treated water S14 532 665 1221 1.00 S20 66 99 276 Wastewater Treatment 0.913 (0.760/0.153) 1.00 S13 112 7518 6917 S18 Lime and polymer 286 Units S16 31 93 125 Waste water 0.001 Biogas Volume flow [m3/d] Chemical mass flow [kg/d] BOD5 mass flow [kg/d] TSS mass flow [kg/d] 1100 S19 Biosolids Anaerobic digestion 0.170 (0.148/0.022) Dewatering 0.081 (0.052/0.029) S15 Biogas# S17 Electricity [kWh/d] Heat [kWh/d] 15 419 1138 4090 81 1237 4080 10840 460 Biogas [$/(m3/d)] Water [m3/d] 2141 Unit process Total cost [$/m3] (capital/operating) 0.198 Boiler BOD5: Biochemical oxygen demand TSS: Total suspended solids (0.175/0.023) 7
