Understanding Multi-morbidity and Deprivation in UK General Practice


M
u
l
t
i
m
o
r
b
i
d
i
t
y
i
n
U
K
g
e
n
e
r
a
l
p
r
a
c
t
i
c
e
-
e
x
p
l
o
r
i
n
g
i
t
s
l
i
n
k
s
w
i
t
h
d
e
p
r
i
v
a
t
i
o
n
a
n
d
l
i
f
e
e
x
p
e
c
t
a
n
c
y
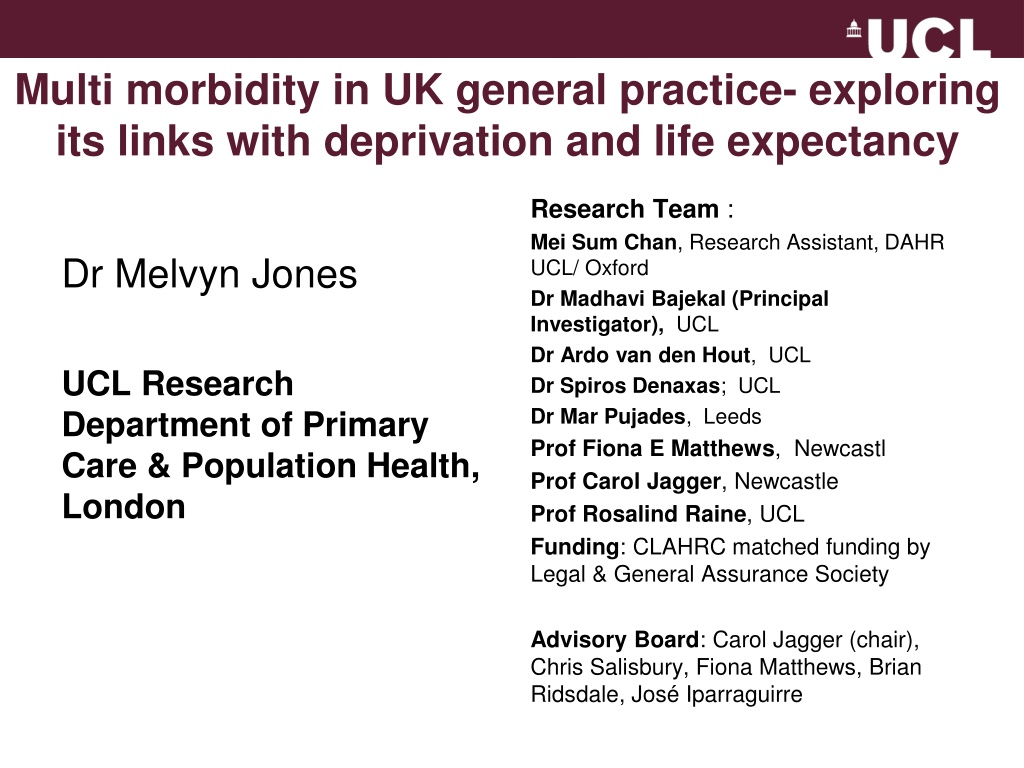
Dr Melvyn Jones
U
C
L
R
e
s
e
a
r
c
h
D
e
p
a
r
t
m
e
n
t
o
f
P
r
i
m
a
r
y
C
a
r
e
&
P
o
p
u
l
a
t
i
o
n
H
e
a
l
t
h
,
L
o
n
d
o
n
R
e
s
e
a
r
c
h
T
e
a
m
:
M
e
i
S
u
m
C
h
a
n
,
R
e
s
e
a
r
c
h
A
s
s
i
s
t
a
n
t
,
D
A
H
R
U
C
L
/
O
x
f
o
r
d
D
r
M
a
d
h
a
v
i
B
a
j
e
k
a
l
(
P
r
i
n
c
i
p
a
l
I
n
v
e
s
t
i
g
a
t
o
r
)
,
U
C
L
D
r
A
r
d
o
v
a
n
d
e
n
H
o
u
t
,
U
C
L
D
r
S
p
i
r
o
s
D
e
n
a
x
a
s
;
U
C
L
D
r
M
a
r
P
u
j
a
d
e
s
,
L
e
e
d
s
P
r
o
f
F
i
o
n
a
E
M
a
t
t
h
e
w
s
,
N
e
w
c
a
s
t
l
P
r
o
f
C
a
r
o
l
J
a
g
g
e
r
,
N
e
w
c
a
s
t
l
e
P
r
o
f
R
o
s
a
l
i
n
d
R
a
i
n
e
,
U
C
L
F
u
n
d
i
n
g
:
C
L
A
H
R
C
m
a
t
c
h
e
d
f
u
n
d
i
n
g
b
y
L
e
g
a
l
&
G
e
n
e
r
a
l
A
s
s
u
r
a
n
c
e
S
o
c
i
e
t
y
A
d
v
i
s
o
r
y
B
o
a
r
d
:
C
a
r
o
l
J
a
g
g
e
r
(
c
h
a
i
r
)
,
C
h
r
i
s
S
a
l
i
s
b
u
r
y
,
F
i
o
n
a
M
a
t
t
h
e
w
s
,
B
r
i
a
n
R
i
d
s
d
a
l
e
,
J
o
s
é
I
p
a
r
r
a
g
u
i
r
r
e
A
i
m
To examine socioeconomic inequalities
in the age of onset of chronic disease,
and quantify life expectancy with and
without complex multimorbidity.
B
a
c
k
g
r
o
u
n
d
:
•
The prevalence of multi morbidity (MM) increases with
age.
•
MM link with deprivation is complex
–
earlier disease onset
–
Shorter life expectancy
–
frequent co-occurrence of mental health illness with physical
conditions.
–
Smoking may be an important explanatory factor?
The contribution of MM to inequalities
•
in life expectancy (shortened life)
•
disease burden (living longer with more diseases)
In relation to deprivation this needs to be quantified.
M
u
l
t
i
m
o
r
b
i
d
i
t
y
,
a
n
d
d
e
p
r
i
v
a
t
i
o
n
a
r
e
k
e
y
i
s
s
u
e
s
i
n
g
e
n
e
r
a
l
p
r
a
c
t
i
c
e
Older populations and pockets of deprived
communities are nearly universal in UK general
practice and so an increased prevalence of multi
morbidity will impact substantially on GP workload.
High impact of MM on individuals
M
e
t
h
o
d
s
:
•
Database study
Multi-state models were used to estimate
–
years spent healthy and with multimorbidity,
–
stratified by sex,
–
By smoking status (never-, ex-, current-
smoker)
–
By quintiles of small area deprivation
•
IMD 2007 (small areas pop c 1500)
–
ISAC/MHRA approval and Clinicaltrials.gov
(NCT02609516)
D
a
t
a
s
o
u
r
c
e
s
•
electronic health records from 225 GP practices
in England (CPRD)
•
Office of National Statistics (ONS) for deaths
•
a cohort of 1.1 million English people aged 45
and older
•
followed up from 2001–2010.
•
to track the incidence and prevalence of 30
chronic health conditions
‘
B
i
g
D
a
t
a
’
:
l
i
n
k
e
d
E
l
e
c
t
r
o
n
i
c
H
e
a
l
t
h
R
e
c
o
r
d
s
C
P
R
D
Dataset
7
N
o
t
e
s
:
E
C
G
=
E
l
e
c
t
r
o
c
a
r
d
i
o
g
r
a
p
h
y
,
S
T
E
M
I
=
S
T
-
s
e
g
m
e
n
t
e
l
e
v
a
t
i
o
n
M
y
o
c
a
r
d
i
a
l
I
n
f
a
r
c
t
i
o
n
,
A
C
E
I
=
A
n
g
i
o
t
e
n
s
i
n
-
c
o
n
v
e
r
t
i
n
g
-
e
n
z
y
m
e
I
n
h
i
b
i
t
o
r
.
S
p
i
r
o
s
C
D
e
n
a
x
a
s
e
t
a
l
.
I
n
t
.
J
.
E
p
i
d
e
m
i
o
l
.
2
0
1
2
;
i
j
e
.
d
y
s
1
8
8
D
e
f
i
n
i
t
i
o
n
s
•
Multimorbidity
was
operationalised
as having two or
more of 30 major
chronic diseases
for this study
What is Multimorbidity (MM)?
“the co-occurence of two or
more
chronic conditions
within
one person
without specifying
an index condition
”
A chronic condition/disease is a
“health problem that requires
management
over a period of
years
or decades
” (WHO)
C
h
a
l
l
e
n
g
e
–
w
h
i
c
h
d
i
s
e
a
s
e
s
?
•
Considerable methodological, conceptual and clinical
challenges
•
Systematic review/ expert advice
–
No clear break point, no consensus
•
Conflicting views on how to define multi-morbidity
–
(health conditions-eg pain; syndromes-eg sensory deficits)
•
Always easier to justify adding a disease
–
Low prevalence but serious disease like MND
•
Each disease requires 10-20 hours to produce a final, approved
code list (Read code + ICD10)
Which diseases?
Listing long-term conditions based on
prevalence/frequency
Selecting TOP 5 – misses out
Cancer
Selecting Top 10 – misses out a MM
patient with
hypertension
,
kidney
failure
,
heart failure
and
osteoporosis
Selecting
Top 20 – misses out
patients with diseases like
Parkinson’s or liver disease
•
Risk factors* or chronic diseases?
* hypertension, hyperlipidaemia,
hyper cholesterol
From: Mercer S, Salisbury C, Fortin M
:
ABC of Multimorbidity
, Wiley 2014.
Disease Prevalence
8
L
i
s
t
o
f
d
i
s
e
a
s
e
s
i
n
-
s
c
o
p
e
(
3
0
)
Which Diseases?
9
P
r
o
f
i
l
e
•
1.1 million individuals (after 168,000 without
smoking status so removed )
•
Baseline
–
47.5% healthy
–
28.3% had one diseases
–
24.1% MM
•
At the study end 12.7% (~100,000) had died
R
e
s
u
l
t
s
Higher life expectancy at age 65 for the least (Quintile
1- (Q1) compared to most deprived (Q5)
Without multimorbidity
–
a two-year gap in healthy life expectancy for men (Q1: 7.7
years [95% CI: 6.4–8.5] vs Q5: 5.4 [4.4–6.0])
–
a three-year gap for women (Q1: 8.6 [7.5– 9.4] vs Q5: 5.9
[4.8–6.4]);
With multimorbidity
–
a one-year gap in life expectancy for men (Q1: 10.4 [9.9–
11.2] vs Q5: 9.1 [8.7–9.6])
–
but none for women (Q1: 11.6 [11.1–12.4] vs Q5: 11.5
[11.1–12.2]).
L
i
f
e
e
x
p
e
c
t
a
n
c
y
f
o
r
m
e
n
a
g
e
d
6
5
(
y
e
a
r
s
s
p
e
n
t
+
v
e
(
w
i
t
h
M
M
)
–
v
e
(
w
i
t
h
o
u
t
M
M
)
T
o
t
a
l
l
i
f
e
e
x
p
e
c
t
a
n
c
y
I
n
c
i
d
e
n
c
e
r
a
t
e
s
o
f
M
M
a
g
e
d
>
4
5
R
e
s
u
l
t
s
Deprived groups
–
have an earlier onset of the first disease,
–
a quicker progression to multi morbidity,
–
more years living with diseases and for men dying younger.
Inequalities were attenuated but not fully attributable to
socioeconomic differences in smoking prevalence:
Multimorbidity onset was latest for never smokers,
Subsequent survival was longer for never and ex smokers
.
C
o
n
c
l
u
s
i
o
n
s
•
The association between social disadvantage and multi
morbidity is complex.
•
By quantifying sociodemographic and smoking-related
contributions to multimorbidity onset and subsequent
survival, we provide evidence for more equitable allocation
of prevention and health care resources to meet local
needs.
S
t
r
e
n
g
t
h
s
•
Longitudinal, multi stage multi
outcome
•
Explore rate of diseases
accumulation / death
•
Can derive life expectancy with
/ without MM
•
Data set is UK representative-
links GP/ hospital & ONS
W
e
a
k
n
e
s
s
e
s
•
Routine data…
•
Coding between practices/
hospitals
•
MH/ MSK ? Under recorded
•
Pain ….
•
Disease severity not captured eg
asthma
•
SE circumstances – not individual
patients
•
If not 30 diseases then “healthy”
(but may still be “ill”)
•
Under represent disease burden
eg MND, & SE disease burden
•
Different disease burden for each
condition eg stable angina vs
renal failure both count as 1
disease
I
m
p
l
i
c
a
t
i
o
n
s
f
o
r
p
r
i
m
a
r
y
c
a
r
e
Likely to be excess workload in primary care in deprived
areas
–
50% of men MM at 65 in most deprived areas
–
Women have higher MM prevalence (Especially in Q5)
–
Women have a higher life expectancy with MM
Multimorbidity will be in middle age not just the elderly
–
20% of men MM at 45 in most deprived areas
Can we do more to address men’s life expectancy?
Can we do more for women living with MM?
Smoking cessation is (still) key
U
C
L
M
u
l
t
i
m
o
r
b
i
d
i
t
y
P
r
o
j
e
c
t
“
S
o
c
i
o
e
c
o
n
o
m
i
c
i
n
e
q
u
a
l
i
t
i
e
s
i
n
h
e
a
l
t
h
e
x
p
e
c
t
a
n
c
y
w
i
t
h
a
n
d
w
i
t
h
o
u
t
m
u
l
t
i
p
l
e
m
o
r
b
i
d
i
t
i
e
s
”
R
e
f
e
r
e
n
c
e
s
•
Barnett K, Epidemiology of multimorbidity and implications for health care, research, and
medical education: a cross-sectional study. Lancet 2012; 380: 37–43
•
Huntley AL, Measures of multimorbidity and morbidity burden for use in primary care and
community settings: a systematic review and guide. Ann Fam Med. 2012
•
Diederichs C, (2011). The measurement of multiple chronic diseases- a systematic review.
J Geront A Biol Sci Med Sci. 2011 March: 66A(3): 301-311
•
Salisbury C. Epidemiology & impact of multimorbidity in primary care.
BJGP 2011
•
Cooke G. Common general practice presentations and publication frequency. 42, 1, Jan
2013
•
Melzer et al. The Age UK almanac of disease profiles in later life – A reference on the
frequency of major diseases, conditions and syndromes affecting older people in England.
Age UK Report 2015
•
K
e
l
l
y
L
A
,
P
r
e
s
t
o
n
S
H
.
T
h
e
c
o
n
t
r
i
b
u
t
i
o
n
o
f
a
h
i
s
t
o
r
y
o
f
h
e
a
v
y
s
m
o
k
i
n
g
t
o
S
c
o
t
l
a
n
d
’
s
m
o
r
t
a
l
i
t
y
d
i
s
a
d
v
a
n
t
a
g
e
.
P
o
p
u
l
a
t
i
o
n
s
t
u
d
i
e
s
2
0
1
6
•
Jackson C. Multi-state models for panel data: The msm Package for R.
Journal of
Statistical Software
38, 2011
•
van den Hout A. ELECT: Estimation of life expectancies using continuous-time multi-state
survival models vignette v0.1.2.
http://www.ucl.ac.uk/~ucakadl/ELECT/ELECTManual_version0_1_2.pdf
References
P
u
b
l
i
s
h
e
d
s
i
n
c
e
a
b
s
t
r
a
c
t
s
u
b
m
i
t
t
e
d
I
n
t
e
r
n
a
t
i
o
n
a
l
J
o
u
r
n
a
l
o
f
E
p
i
d
e
m
i
o
l
o
g
y
D
O
I
1
0
.
1
0
9
3
/
i
j
e
/
d
y
z
0
5
2
Q
u
e
s
t
i
o
n
s
?
Further information
•
Contact
melvyn.jones@ucl.ac.uk
•
Multimorbidity Project Contact:
m.bajekal@ucl.ac.uk
M
e
t
h
o
d
s
•
Cox models
•
Fully parametric version of Cox for each type of
health transition
•
Evaluated simultaneously
–
t
i
m
e
s
p
e
n
t
w
i
t
h
o
u
t
M
M
S
m
o
k
i
n
g
-
L
i
f
e
e
x
p
e
c
t
a
n
c
y
(
m
e
n
)
a
g
e
6
5
Never smokers
–
Q1
8.6
(6.2-9.5)
without MM
–
10.3
(9.7-11.8)
with MM
–
Total
18.9 yrs
–
Q5
6.6
(3.4-7.5)
without MM
–
9.4
(8.8-11.2)
with MM
–
Total
16.0 yrs
Current smokers
–
Q1
6.3
(3.2-7.2)
without MM
8.6
(8-10.3)
with MM
Total
14.9 yrs
-Q5
4.2
(2.8-4.8)
without MM
7.4
(7-8.2)
with MM
Total
11.6 yrs
Exploring the association between multi-morbidity, deprivation, and life expectancy in the context of UK general practice. The research aims to quantify socio-economic inequalities in chronic disease onset and life expectancy, particularly among older populations with multi-morbidity. Methods include a database study using multi-state models to estimate healthy years and years spent with multi-morbidity based on various factors such as smoking status and area deprivation levels.

Download Presentation

Please find below an Image/Link to download the presentation.
The content on the website is provided AS IS for your information and personal use only. It may not be sold, licensed, or shared on other websites without obtaining consent from the author. Download presentation by click this link. If you encounter any issues during the download, it is possible that the publisher has removed the file from their server.
E N D
Presentation Transcript
Multi morbidity in UK general practice- exploring its links with deprivation and life expectancy Research Team : Mei Sum Chan, Research Assistant, DAHR UCL/ Oxford Dr Madhavi Bajekal (Principal Investigator), UCL Dr Ardo van den Hout, UCL Dr Spiros Denaxas; UCL Dr Mar Pujades, Leeds Prof Fiona E Matthews, Newcastl Prof Carol Jagger, Newcastle Prof Rosalind Raine, UCL Funding: CLAHRC matched funding by Legal & General Assurance Society Dr Melvyn Jones UCL Research Department of Primary Care & Population Health, London Advisory Board: Carol Jagger (chair), Chris Salisbury, Fiona Matthews, Brian Ridsdale, Jos Iparraguirre
Aim To examine socioeconomic inequalities in the age of onset of chronic disease, and quantify life expectancy with and without complex multimorbidity.
Background: The prevalence of multi morbidity (MM) increases with age. MM link with deprivation is complex earlier disease onset Shorter life expectancy frequent co-occurrence of mental health illness with physical conditions. Smoking may be an important explanatory factor? The contribution of MM to inequalities in life expectancy (shortened life) disease burden (living longer with more diseases) In relation to deprivation this needs to be quantified.
Multi morbidity, and deprivation are key issues in general practice Older populations and pockets of deprived communities are nearly universal in UK general practice and so an increased prevalence of multi morbidity will impact substantially on GP workload. High impact of MM on individuals
Methods: Database study Multi-state models were used to estimate years spent healthy and with multimorbidity, stratified by sex, By smoking status (never-, ex-, current- smoker) By quintiles of small area deprivation IMD 2007 (small areas pop c 1500) ISAC/MHRA approval and Clinicaltrials.gov (NCT02609516)
Data sources electronic health records from 225 GP practices in England (CPRD) Office of National Statistics (ONS) for deaths a cohort of 1.1 million English people aged 45 and older followed up from 2001 2010. to track the incidence and prevalence of 30 chronic health conditions
Dataset Big Data : linked Electronic Health Records CPRD Notes: ECG = Electrocardiography, STEMI = ST-segment elevation Myocardial Infarction, ACEI = Angiotensin-converting-enzyme Inhibitor. Spiros C Denaxas et al. Int. J. Epidemiol. 2012;ije.dys188 7
Definitions What is Multimorbidity (MM)? the co-occurence of two or more chronic conditions within one person without specifying an index condition Multimorbidity was operationalised as having two or more of 30 major chronic diseases for this study A chronic condition/disease is a health problem that requires management over a period of years or decades (WHO)
Which diseases? Challenge which diseases? Considerable methodological, conceptual and clinical challenges Systematic review/ expert advice No clear break point, no consensus Conflicting views on how to define multi-morbidity (health conditions-eg pain; syndromes-eg sensory deficits) Always easier to justify adding a disease Low prevalence but serious disease like MND Each disease requires 10-20 hours to produce a final, approved code list (Read code + ICD10)
Listing long-term conditions based on prevalence/frequency Hypertension* Obesity* Diabetes Selecting TOP 5 misses out Cancer COPD Asthma Selecting Top 10 misses out a MM patient with hypertension, kidney failure, heart failure and osteoporosis High cholesterol* Cancer (malignant) CHD (angina, heart attack) Disease Prevalence Depression Osteoarthritis Selecting Top 20 misses out patients with diseases like Parkinson s or liver disease Stroke Thyroid disorder Renal failure (CKD) Anxiety Osteoporosis Risk factors* or chronic diseases? Dementia * hypertension, hyperlipidaemia, hyper cholesterol Rheumatic Arthritis From: Mercer S, Salisbury C, Fortin M: ABC of Multimorbidity, Wiley 2014. Heart Failure Chronic back pain Other arthritis 8
Which Diseases? List of diseases in-scope (30) Asthma or COPD or bronchiectasis Dementia or Alzheimer's Osteoporosis Atrial Fibrillation Diverticulitis of intestine Osteoarthritis (active Rx) or Chronic severe back pain Peripheral Arterial Disease Anxiety Epilepsy Alcohol problems Glaucoma Parkinson's disease Coronary Heart Disease Hypothyroidism Psychoactive substance misuse Prostate disorders Chronic Kidney Disease (CKD 4,5) Heart Failure Cancer (in last 5 years) Inflammatory Bowel Disease Psoriasis Chronic liver disease Learning Disabilities Rheumatoid Arthritis Depression (ever + SSRI last year) Multiple Sclerosis Stroke or TIA Diabetes Motor Neurone Disease Severe Mental Illness 9
Profile 1.1 million individuals (after 168,000 without smoking status so removed ) Baseline 47.5% healthy 28.3% had one diseases 24.1% MM At the study end 12.7% (~100,000) had died
Results Higher life expectancy at age 65 for the least (Quintile 1- (Q1) compared to most deprived (Q5) Without multimorbidity a two-year gap in healthy life expectancy for men (Q1: 7.7 years [95% CI: 6.4 8.5] vs Q5: 5.4 [4.4 6.0]) a three-year gap for women (Q1: 8.6 [7.5 9.4] vs Q5: 5.9 [4.8 6.4]); With multimorbidity a one-year gap in life expectancy for men (Q1: 10.4 [9.9 11.2] vs Q5: 9.1 [8.7 9.6]) but none for women (Q1: 11.6 [11.1 12.4] vs Q5: 11.5 [11.1 12.2]).
Life expectancy for men aged 65 (years spent +ve (with MM) ve (without MM)
Results Deprived groups have an earlier onset of the first disease, a quicker progression to multi morbidity, more years living with diseases and for men dying younger. Inequalities were attenuated but not fully attributable to socioeconomic differences in smoking prevalence: Multimorbidity onset was latest for never smokers, Subsequent survival was longer for never and ex smokers.
Conclusions The association between social disadvantage and multi morbidity is complex. By quantifying sociodemographic and smoking-related contributions to multimorbidity onset and subsequent survival, we provide evidence for more equitable allocation of prevention and health care resources to meet local needs.
Weaknesses Strengths Routine data Coding between practices/ hospitals MH/ MSK ? Under recorded Pain . Disease severity not captured eg asthma SE circumstances not individual patients If not 30 diseases then healthy (but may still be ill ) Under represent disease burden eg MND, & SE disease burden Different disease burden for each condition eg stable angina vs renal failure both count as 1 disease Longitudinal, multi stage multi outcome Explore rate of diseases accumulation / death Can derive life expectancy with / without MM Data set is UK representative- links GP/ hospital & ONS
Implications for primary care Likely to be excess workload in primary care in deprived areas 50% of men MM at 65 in most deprived areas Women have higher MM prevalence (Especially in Q5) Women have a higher life expectancy with MM Multimorbidity will be in middle age not just the elderly 20% of men MM at 45 in most deprived areas Can we do more to address men s life expectancy? Can we do more for women living with MM? Smoking cessation is (still) key
UCL Multimorbidity Project Socioeconomic inequalities in health expectancy with and without multiple morbidities
References References Barnett K, Epidemiology of multimorbidity and implications for health care, research, and medical education: a cross-sectional study. Lancet 2012; 380: 37 43 Huntley AL, Measures of multimorbidity and morbidity burden for use in primary care and community settings: a systematic review and guide. Ann Fam Med. 2012 Diederichs C, (2011). The measurement of multiple chronic diseases- a systematic review. J Geront A Biol Sci Med Sci. 2011 March: 66A(3): 301-311 Salisbury C. Epidemiology & impact of multimorbidity in primary care. BJGP 2011 Cooke G. Common general practice presentations and publication frequency. 42, 1, Jan 2013 Melzer et al. The Age UK almanac of disease profiles in later life A reference on the frequency of major diseases, conditions and syndromes affecting older people in England. Age UK Report 2015 Kelly LA, Preston SH. The contribution of a history of heavy smoking to Scotland s mortality disadvantage. Population studies 2016 Jackson C. Multi-state models for panel data: The msm Package for R. Journal of Statistical Software 38, 2011 van den Hout A. ELECT: Estimation of life expectancies using continuous-time multi-state survival models vignette v0.1.2. http://www.ucl.ac.uk/~ucakadl/ELECT/ELECTManual_version0_1_2.pdf
Published since abstract submitted International Journal of Epidemiology DOI 10.1093/ije/dyz052
Questions? Further information Contact melvyn.jones@ucl.ac.uk Multimorbidity Project Contact: m.bajekal@ucl.ac.uk
Methods Cox models Fully parametric version of Cox for each type of health transition Evaluated simultaneously
Smoking -Life expectancy (men) age 65 Never smokers Q1 8.6 (6.2-9.5) 10.3 (9.7-11.8) Total Q5 6.6 (3.4-7.5) 9.4 (8.8-11.2) Total Current smokers Q1 6.3 (3.2-7.2) 8.6 (8-10.3) Total -Q5 4.2 (2.8-4.8) 7.4 (7-8.2) without MM with MM 18.9 yrs without MM with MM 16.0 yrs without MM with MM 14.9 yrs without MM with MM Total 11.6 yrs


 age 65")