Optimal Monograph Preservation in Shared Print Collections
A model is proposed by Ian Bogus, Candace Arai Yano, Shannon Zachary, Jacob Nadal, Mary Miller, Helen N. Levenson, Fern Brody, and Sara Amato to determine the ideal number of monograph copies for preservation in shared print collections. The model considers variables such as on-shelf probability, bibliographic inaccuracy, annual loss rate, and physical deterioration over time. By combining these variables, the model aims to optimize preservation efforts to ensure the longevity of monographs in a cost-effective manner.

Download Presentation

Please find below an Image/Link to download the presentation.
The content on the website is provided AS IS for your information and personal use only. It may not be sold, licensed, or shared on other websites without obtaining consent from the author.If you encounter any issues during the download, it is possible that the publisher has removed the file from their server.
You are allowed to download the files provided on this website for personal or commercial use, subject to the condition that they are used lawfully. All files are the property of their respective owners.
The content on the website is provided AS IS for your information and personal use only. It may not be sold, licensed, or shared on other websites without obtaining consent from the author.
E N D
Presentation Transcript
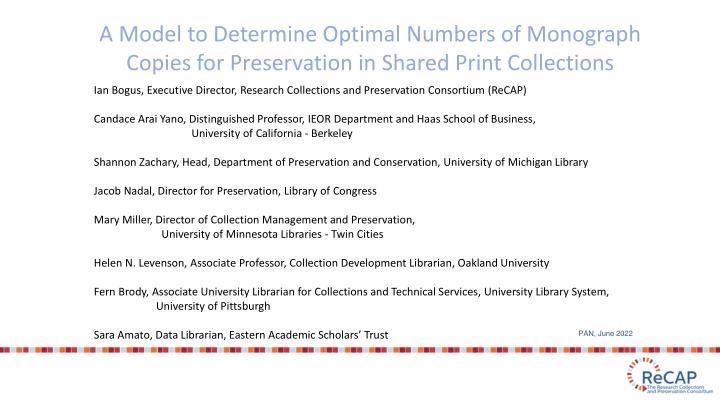
A Model to Determine Optimal Numbers of Monograph Copies for Preservation in Shared Print Collections Ian Bogus, Executive Director, Research Collections and Preservation Consortium (ReCAP) Candace Arai Yano, Distinguished Professor, IEOR Department and Haas School of Business, University of California - Berkeley Shannon Zachary, Head, Department of Preservation and Conservation, University of Michigan Library Jacob Nadal, Director for Preservation, Library of Congress Mary Miller, Director of Collection Management and Preservation, University of Minnesota Libraries - Twin Cities Helen N. Levenson, Associate Professor, Collection Development Librarian, Oakland University Fern Brody, Associate University Librarian for Collections and Technical Services, University Library System, University of Pittsburgh PAN, June 2022 Sara Amato, Data Librarian, Eastern Academic Scholars Trust
Signs of success Recommendation too low Recommendation too high Why is Ian a Bad Librarian?
Pub. Date % Present Variable 1: On-shelf probability <1800 91.30% 1800-1810 94.74% 1811-1820 92.59% 1911-1920 97.45% 1821-1830 98.13% 1921-1930 97.70% 1831-1840 96.67% 1931-1940 96.97% Draft value: 97% Stacks 100% Storage 1841-1850 95.75% 1941-1950 96.92% 1851-1860 97.09% 1951-1960 97.01% 1861-1870 97.35% 1961-1970 97.07% 1871-1880 97.97% 1971-1980 97.21% 1881-1890 97.34% 1981-1990 97.40% 1891-1900 97.61% 1991-2000 97.64% 1901-1910 96.94% 2001-2010 97.90%
Variable 2: Bibliographic inaccuracy Draft value: 0.1% Stacks 0% Storage https://www.flickr.com/photos/68103485@N05/6197933357
Variable 3: Annual loss rate Draft value: 0.01% Stacks 0% Storage https://pixabay.com/photos/seasons-4-seasons-four-seasons-5880236/
Variable 4: Physical Deterioration Over Time https://www.needpix.com/photo/1530668/book-old-grunge-literacy-literate-illiterate-read-trash-garbage
Combining Variables ME! (probably of neither being 6 nor having blue eyes) P = P1 * P2 1.5% = 15% * 10 % 76.5% = (1 15%) * (1 - 10%) P = Probability affected both P1 = Probability affected by #1 P = Probability both 6 and blue eyes P1 = Probability of someone being 6 (15%) P2 = Probability of someone having blue eyes (10%) P2 = Probability affected by #2
Probability one item is usable Probability that at least one item in group is usable ?1 P1 = (1 [(1 ?2?)?2] [(1 ???)??]) 1 ?1? ???= ? (1 ?) [ 1 ??] ??? ???= the probability that any given copy of type i exists and is usable at time ? = on-shelf probability; ? = bibliographic inaccuracy rate; ? = annual loss rate; ? = retention horizon. ???= probability that any given copy of a book of type i is usable at time T P1 = probability that at least one usable copy remains at the end of a specified time horizon ?? = number of copies of type i; ? = number of types; ???= the probability that any given copy of type i exists and is usable at time
Draft values 99.8% survive at horizon (1 in 500 titles lost) On-shelf probability: 97% for books in the stacks and 100% for books in storage Bibliographic inaccuracy: 0.1% for books in the stacks and 0% for books in storage Annual loss rate: 0.01% for books in the stacks and 0% for books in storage Usability trajectories as described in the subsection on Physical Deterioration over Time.
Thank you Ian Bogus ibogus@Princeton.edu