Understanding Ethnicity in Scotland: Diversity, Health Disparities & Demographic Shifts
The data presented delves into the significance of ethnicity in Scotland, highlighting health trends and demographic changes. It showcases disparities in disease prevalence among ethnic groups, variations in healthcare screening attendance, and the evolving diversity landscape. From examining the impact of ethnicity on health outcomes to exploring the growing population born outside the UK, the visuals underscore the complex interplay between identity, ethnicity, and health factors in Scotland.

Download Presentation

Please find below an Image/Link to download the presentation.
The content on the website is provided AS IS for your information and personal use only. It may not be sold, licensed, or shared on other websites without obtaining consent from the author. Download presentation by click this link. If you encounter any issues during the download, it is possible that the publisher has removed the file from their server.
E N D
Presentation Transcript
Ethnicity- why it matters DRS in-service training day 12thNovember 2013 Dr Joy Tomlinson
Why does it matter? DRIVE UK study (2 cohorts, Yorkshire & London), 50,285 people- March 2012. Prevalence of any DR 38% prevalence in White Europeans 52% in Afro/Afro-caribbeans 43% in South Asians STDR 5.5% in White Europeans 11.5% in Afro/Afro-Carribbeans 10.3% in South Asians
Percentage attending DRS for screening by ethnic group (source: SOARIAN, April 2013) 100% 90% Percentage attending 80% 70% 60% 50% 40% 30% 20% 10% 0% Indian Chinese Other White Pakistani Bangladeshi Black African Other White British White Scottish Black Caribean Ethnicity
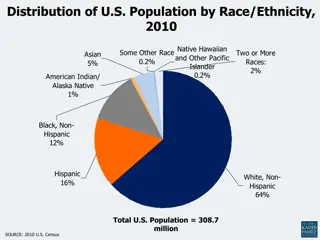
Over time, Scotland is becoming more diverse. But there is no easy summary. Identity, ethnicity and place of birth tell different aspects of a story. People born outside the UK by council area, Scotland, 2001 and 2011 Percentage of population born outside the UK 2001 3.0 8.3 2.6 2.9 2011 5.3 15.9 4.0 5.6 East Lothian Edinburgh, City of Midlothian West Lothian Aberdeen City Glasgow City 6.3 5.7 15.9 12.2 Scotland 3.8 7.0
Percentage (of people born outside Change in number: 2001 to 2011 Country All people born outside the UK Number the UK) 369,000 100 178,000 Poland India Republic of Ireland Germany Pakistan United States of America China South Africa Nigeria Canada Australia Hong Kong (Special Admin. Region of China) France Italy Spain Other 55,000 23,000 23,000 22,000 20,000 15 6.4 6.2 53,000 13,000 1,000 4,000 7,000 6 5.4 16,000 15,000 11,000 9,000 9,000 8,000 4.3 4.2 2.9 2.6 2.6 2.2 5,000 12,000 3,000 8,000 1,000 1,000 8,000 7,000 6,000 5,000 131,000 2.1 1.9 1.6 1.3 35.4 1,000 2,000 1,000 2,000 64,000
Asian, Asian Scottish or Asian British form the largest non-white group in Scotland Asian, Asi an Sco ttish or Asi an Briti sh 1.6 2.1 Caribbe Other an or Bla ck eth nic gro ups Mixed or multiple ethnic groups White African Fife Grampian Greater Glasgow & Clyde Highland Lanarkshire Lothian Scotland 97.6 96 0.3 0.4 0.2 0.1 0.2 0.1 0.3 1 92.7 98.7 98 94.4 96 0.4 0.3 0.2 0.6 0.4 5.2 0.8 1.5 3.7 2.7 1.2 0.1 0.2 0.6 0.6 0.2 0.1 0.1 0.2 0.1 0.4 0.1 0.1 0.5 0.3
Cities drive diversity but there are different trends across Scotland Asian, Asi Mixed or an Sco ttish or Asi an Briti sh mu ltipl Caribb e ea Other eth nic gro ups eth nic gro ups n or Bla ck White African All people Fife 365,198 356,550 1,257 5,748 704 422 517 Grampian 569,061 546,090 2,491 12,155 5,620 914 1,791 GG&C 1,213,408 1,124,944 4,694 62,568 14,129 2,170 4,903 Highland 320,298 316,048 941 2,431 321 277 280 Lanarkshire 574,637 563,086 1,272 8,444 963 319 553 Lothian 834,350 787,451 5,194 31,069 5,264 1,355 4,017 Scotland 5,295,403 5,084,407 19,815 140,678 29,638 6,540 14,325
Lothians population is more ethnically diverse than most of Scotland. Edinburgh has the highest proportion of non white Scots and the largest number of Polish people Asian, Asian Scottis h or Asian British Other ethni c grou ps White - Scotti sh White - Other British White - Polish White - Other White - Irish East Lothian 85.6% 9.3% 0.9% 0.8% 1.7% 1.0% 0.8% Edinburgh 70.3% 11.8% 1.8% 2.7% 5.1% 5.5% 2.8% Midlothian West Lothian 90.0% 5.8% 0.6% 0.5% 1.3% 1.1% 0.8% 87.8% 5.8% 0.7% 1.9% 1.3% 1.7% 0.8% Lothian Scotland 77.8% 84.0% 9.6% 7.9% 1.3% 1.0% 2.1% 1.2% 3.5% 1.9% 3.7% 2.7% 2.0% 1.4%
Lothians population is more ethnically diverse than most of Scotland. Edinburgh has the highest proportion of non white Scots and the largest number of Polish people 2011 census: Ethnicity in selected Scottish geographies 100% 90% Other ethnic groups 80% 70% Asian, Asian Scottish or Asian British White - Other Proportion 60% 50% 40% 30% White - Polish 20% White - Irish 10% 0% White - Other British Lothian Midlothian Edinburgh Scotland West Lothian East Lothian White - Scottish Area
Compared to Lothian, the SOARIAN database shows a higher proportion of Asian and mixed ethnicity patients diabetes prevalence is higher among some ethnic groups notably South Asians Census and SOARIAN ethnicity crude comparison 100 90 80 70 60 Percentage Scotland 2011 Lothian 2011 SOARIAN 50 40 30 20 10 0 All white All Asian All African All Caribbean Mixed/multiple ethnic groups Ethnic group
Compared to Lothian, the SOARIAN database shows a higher proportion of Asian and mixed ethnicity patients diabetes prevalence is higher among some ethnic groups notably South Asians Mixed/ multiple ethnic groups All Caribb ean All white All Asian All African Scotland 2011 Lothian 2011 96.0 0.6 2.7 0.6 0.1 94.3 1.1 3.7 0.6 0.2 SOARIAN 90.6 4.3 4.5 0.6 0.03
Scotland % Lothian % SOARIAN % White: Scottish White: Other British White: Irish White: Other Mixed/multiple Asian, Asian Scottish or Asian British: Pakistani, Pakistani Scottish or Pakistani British Asian, Asian Scottish or Asian British: Indian, Indian Scottish or Indian British 83.95 7.88 1.02 3.16 0.64 77.75 9.63 1.34 5.66 1.10 73.13 12.37 0.61 4.44 4.31 0.93 0.95 1.86 0.62 0.91 1.10 Asian, Asian Scottish or Asian British: Bangladeshi, Bangladeshi Scottish or Bangladeshi British Asian, Asian Scottish or Asian British: Chinese, Chinese Scottish or Chinese British Asian, Asian Scottish or Asian British: Other Asian African: African, African Scottish or African British African: Other African Caribbean 0.07 0.16 0.28 0.64 1.07 0.57 0.40 0.63 0.67 0.55 0.01 0.12 0.62 0.02 0.16 0.53 0.10 0.03