Unveiling the Cosmic Evolution: A Journey Through Galaxies, Stars, and Empty Space
Delve into the intricate story of the universe's evolution from its hot dense origins to the vast cosmic web of stars and galaxies. Explore questions on stellar birth rates, interstellar medium influences, and the role of dark energy. Follow the journey of three students working on the Cosmic Evolution Project, analyzing data to piece together the narrative of cosmic evolution from the Big Bang to the present day. Discover the composition changes of the universe over time, with dark matter, dark energy, and radiant energy shaping its structure.

Download Presentation

Please find below an Image/Link to download the presentation.
The content on the website is provided AS IS for your information and personal use only. It may not be sold, licensed, or shared on other websites without obtaining consent from the author. Download presentation by click this link. If you encounter any issues during the download, it is possible that the publisher has removed the file from their server.
E N D
Presentation Transcript
Cosmic Evolution Project: Why are we here? A Brief History of Galaxies, Stars, and Empty Space Liam Cox, Michael Menhennet, Scott Pirkle, and Dr. Bob Field The mission of the cosmic evolution project is to provide inspiration, educational resources, and training to help students, scholars, educators, and researchers understand and explain the structure and evolution of the universe from the Big Bang to big brains. This summer, three students received Frost Fund awards to work on this project. They helped analyze, synthesize, and disseminate a scientific narrative of the origin and evolution of large scale structure in the universe from cosmic webs to galaxies, stars, and emptyspace . The long term goal of our project is to build simplified but plausible models that characterize the evolution of the universe from a homogeneous hot dense state to a web of stars and galaxies harboring planets and life separated by vast volumes of "empty space". We have compiled a lot of astrophysical data and equations, but are struggling to put it all together. Successive populations of stars co-evolve with the interstellar medium from which they form. What astrophysical processes affect the co-evolution? Can we develop simplified numerical models of the processes? What determines the stellar birth rate? What affects the initial mass distribution of stars? Do the composition, density, and temperature of the interstellar medium set a lower bound for the initial mass distribution of stars via the Jeans mass? Does the Eddington limit set the upper bound? Can we model the Supernova ejections that enrich the metallicity of the interstellar medium for the benefit of future generations of stars? Do dwarf stars enrich the interstellar medium? What role do black holes play?
composition of the universe at age 100 years vs. today Billions of years ago, dark energy was insignificant because of its low density and the density of radiant energy easily dominated matter in terms of their effect on expansion. As a result of the expansion and cooling of the universe, today s universe is about 96% dark matter and dark energy, less than 4% ordinary matter (mostly in intergalactic gas, not stars), and less than 0.1% radiant energy (having red-shifted to microwaves). Changes in the structure of the universe are as awesome as changes in its composition.
one century after Big Bang, universe was 96% radiant energy, 3.2% dark matter, and 0.8% baryonic matter. one century after Big Bang, the universe was 96% radiant energy, 3.2% dark matter, and 0.8% baryonic matter. matter dominated for almost 10 billion years radiant energy dominated for 50,000 years the observable universe contains enough baryonic matter to form three billion billion billion suns
The equations shown below are from our Mathcad model of the expanding universe. The Friedmann equation relates the density of the flat universe to the evolving Hubble constant, cosmic scale factor, density, and temperature. The equations in our Mathcad model define the initial densities of radiant energy, matter, and dark energy, and their total. Radiant energy is 60% photons and 40% neutrinos. Matter is 85% dark matter and 15% baryonic matter, which is mostly protons and neutrons by mass. The equations show that the Hubble constant decreases over time in an expanding universe as the total density decreases. The density of matter decreases as the inverse cube of the increasing cosmic scale factor a. Because of the Doppler shift increase in wavelength, the density of radiant energy decreases as the inverse fourth power of the increasing cosmic scale factor. The density of dark energy is constant so total dark energy increases as the cube of the cosmic scale factor.
Friedmann equation relates the density of the flat universe to the evolving Hubble constant, cosmic scale factor, density, and temperature. density of radiant energy, matter, and dark energy: Hubble constant depends on total density density and temperature decrease as universe expands
Cosmological models of our universe treat it as flat, isotropic, and homogeneous. The following graphs and table were generated in Mathcad with the equations shown above. The universe cools as it expands. In the first graph, the cosmic scale factor a and temperature change by 26 orders of magnitude as time increases by more than 50 orders of magnitude from 10-33 after the inflation epoch to over 300 billion years in the future. The rate of change depends on whether radiant energy, matter, or dark energy are dominant in terms of density. The green lines on the graph intersect at the present time of about 13.7 billion years or 4 x 10¹⁷ seconds at which time the scale factor is defined as unity and the temperature is about 2.73 Kelvin. The second graph shows that as the universe expands, the density and temperature evolve over time. Temperature drops by 26 orders of magnitude, radiant energy density by 100 orders, and matter density by 100 orders as time increases by about 53 orders of magnitude. The third graph shows the density and temperature starting after the first century. The circles show total density which was dominated by radiant energy for the first 50,000 years, dominated by matter for nearly ten billion years, and finally dominated by dark energy for billions of years. The table shows cosmic scale factor, density, and temperature vs. time.
expansion and cooling of our flat universe cosmic scale factor a and temperature change by 26 orders of magnitude as time increases by more than 50 orders of magnitude
density and temperature evolve over time density and temperature decrease by 26 - 100 orders of magnitude as time increases by more than 50 orders of magnitude
density and temperature evolve over time radiant energy dominated for 50,000 years
Table shows cosmic scale factor, density, and temperature vs. time. The universe began in an insanely hot dense state that evolved into empty space as space itself expanded and matter cooled. Dark matter collapsed into halos to form the first large scale structures in a nearly homogeneous universe. The halos attracted ordinary baryonic matter which condensed into molecular clouds which collapsed into stars and galaxies. Giant stars fuse most of their gas into metals which are ejected into the interstellar medium when they explode as supernovas. The metal rich medium provided the building blocks of rocky planets and life in our solar system.
large scale structure of the universe today DM Density ( critical) BM Mass DM Mass Metal Mass Component Total Mass Volume Halos >15 23% 49.1% 44.9% 0.16% 50% Filaments 0.06 15 46% 44.5% 44.8% 21.6% 28% Voids 0 0.06 31% 6.4% 10.4% 78.2% 22% *Ejected Material Inside Voids 0 0.06 23.6% 2.6% 6.1% 30.4%
The largest structure in the universe is the cosmic web which consists of dense nodes connected by filaments and sheets that enclose vast voids. The table shown above is based on an analysis of the Illustris computer simulation by Haider et al that characterized the universe in terms of halos, filaments, and voids. In their model, halos have densities greater than 15 times the average density of the universe and voids have densities about 16 times less dense than average, with filaments having intermediate densities. Remarkably, the voids have 78% of the volume and 31% of the baryonic matter, mostly due to material ejected from stars and galaxies. This is in sharp contrast to the distribution of dark matter. The total mass of each feature is dominated by dark matter which accounts for about 85% of all matter, so relatively high concentrations of baryonic matter have only a modest effect on total matter density. And as a reminder, dark energy does not form structure, so its density is the same everywhere, about 70% of the average density of the universe. The distribution of metal mass also reflects the role of material ejected into the voids from stars and galaxies by active galactic nuclei. The next diagram identifies the primary features of the Milky Way galaxy. It consists of a massive nearly spherical dark matter halo and a distribution of stars and intragalactic medium. Population II stars are found in a nearly spherical stellar halo, a central bulge and a thin disk. Population I stars are concentrated in the younger thin disk, but are also found in the bulge. The galactic center is a supermassive black hole. Much smaller black holes are scattered throughout the galaxy. The spiral arms are regions of high density of interstellar gas and dust where giant stars continue to form and live very brief lives before recycling their metal-enriched gas back into the emptyspace of the interstellar medium.
Milky Way structure you are here thanks to dark matter and dying Supernovas
Milky Way structure with estimated masses Mass (Msun) Radius (kpc) Thickness (kpc) Volume (kpc^3) Density (Msun/kpc^3) structure Density Form dark matter halo 1.E+12 50 50 5.2E+5 1.91E+06 1/(1+r2/r02) thin disk 1.E+11 15 1 710 1.41E+08 e--r/r0e-z/h0 thick disk 1.E+10 15 2 1400 7.07E+06 e--r/r0e-z/h0 bulge 1.E+10 3 3 110 8.84E+07 e--r/r0 stellar halo 1.E+09 20 20 3.4E+4 2.98E+04 r-3.5 interstellar matter supermassive black hole 1.E+10 15 1 707 1.41E+07 1 4.E+06 N/A N/A N/A N/A N/A The table shows the mass, dimensions, and density of the structures of the Milky Way galaxy. Nearly 90% of the mass of the galaxy is in the dark matter halo. Nearly 70% of the ordinary baryonic matter is in the young stars in the thin disk. Most of the rest are distributed fairly uniformly among the thick disk, bulge, and interstellar medium. About 1% of the stellar mass is in the stellar halo. The supermassive black hole has about four million solar masses, a huge number, but only a small fraction of the stellar or galactic mass. Density form factors are models that approximate the distribution of stars and dark matter in the galaxy.
composition of empty space today The intergalactic medium contains most of the baryonic mass. Only 14% is in galaxies. The rest resides in filaments and voids that do not contain many galaxies. Dark matter is the driving force behind galaxy formation and makes up a large portion of our universe.
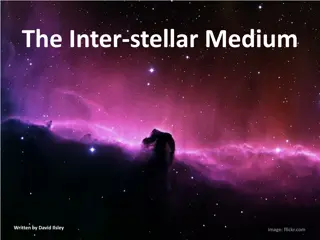
composition of interstellar medium in the Milky Way Fractional volume Scale height (pc) Temperature (K) Density (particles/m3) State of hydrogen Component Molecular clouds < 1% 80 10 20 108 1012 molecular Cold Neutral Medium (CNM) 1 5% 100 300 50 100 20 50 x 106 neutral atomic Warm Neutral Medium (WNM) 10 20% 300 400 6000 10,000 0.2 0.5 x 10⁶ neutral atomic Warm Ionized Medium (WIM) 20 50% 1000 8000 0.2 0.5 x 10⁶ ionized H II regions < 1% 70 8000 108 1010 ionized Coronal gas Hot Ionized Medium (HIM) The interstellar medium is home to the cool dense molecular clouds that breed stars including massive short-lived stars that enrich the metal content of the medium when they explode. Despite their evolutionary importance, the clouds occupy less than 1% of the volume of the medium. Most of the volume is occupied by warm or hot gases that range from 6000 K to several million degrees, too hot to condense into clouds. Metals by definition include any element other than hydrogen or helium, even oxygen, nitrogen, and carbon. ionized (metals also highly ionized) 30 70% 1000 3000 106 107 102 104
Giant stars evolve into supernovas which enrich molecular clouds with metals that they synthesized which are then inherited by the next generation of stars main sequence population II stars main sequence population III stars main sequence population I stars supernovas supernovas supernovas neutron stars and black holes neutron stars and black holes neutron stars and black holes dwarf stars dwarf stars dwarf stars This highly simplified diagram shows the flow of material as giant stars evolve into supernovas which enrich molecular clouds with metals that they synthesized which are then inherited by the next generation of stars. The remains of supernovas may be neutron stars whereas dwarf stars remain dwarf and do not share their synthesized metals with the interstellar medium that breeds the next generation of stars. The diagram shows three populations of stars. The first generation of stars (known as Population III) were metal free and many had masses hundreds of times greater than the sun and lived very brief lives before exploding to enrich interstellar space with the first metals in the universe.
The high star birth rate in the first few billion years enriched later populations of stars with metals that are the building blocks of rocky planets and life
The next chart of initial mass function (IMF) shows the distribution of star formation as a function of mass. This is basically the relative number of stars of any given mass. It also shows the product of IMF and mass which is a measure of the distribution of mass among the stars. The area under the blue curve indicates how much stellar mass is in any given range. The curve suggests that dwarf stars and giant stars have roughly comparable shares of total stellar mass. The most massive stars are rare in number and have a small share of the total mass of stars. Although uncommon, the most massive stars contribute much more than dwarf stars to the evolution of successive populations of stars. Why? Because the most massive stars synthesize great masses of metals very quickly and recycle them when they explode thereby enriching the interstellar medium that is the breeding ground of star formation. They start out with little if any metal content, but by the time they explode, most of their mass of hydrogen and helium has been fused into metals. The explosion itself completes the synthesis of the most massive elements, the ones greater than iron.
The red curve shows the relative number of stars as a function of mass. The blue curve shows the distribution of mass among the stars. IMF or initial mass function mass of stars in mass range
Jeans mass vs. temperature and particle density particles m3 n = 108 1012 T = 10 20 K
The previous chart shows that the local Jeans mass for star formation increases with the local temperature and decreases with the local density of a molecular cloud. What this means is that, perhaps counterintuitively, the coolest, densest regions can more easily form low mass stars. This may help explain the initial mass function which plays a central role in the evolution of successive populations of stars. Since molecular clouds in interstellar medium have densities between 108 and 1012 particles per cubic meter and temperatures between 10 and 20 K, the minimum mass of stars forming is between one and 1000 solar masses. The latter is not possible because of the Eddington limit described in the next chart. Local densities exceeding 1014 particles per cubic meter have Jeans masses that support dwarf stars with masses less than 0.1 solar masses. Earlier populations of stars may have formed from molecular clouds with higher temperatures and higher Jeans mass which favored more giant stars.
radiation pressure limits the growth of giant stars Increasing metallicity increases opacity, decreases Eddington limit, decreases radius, luminosity, temperature, mass of star.
The previous chart of the Eddington limit shows that opacity due to scattering and absorption facilitates radiation pressure which limits the mass that stars can capture during formation. Limited mass means limited luminosity. While observational astronomers focus on luminosity, evolutionary processes are mainly affected by stellar mass and lifetime. The Eddington limit affects the formation of high mass stars which enrich the interstellar medium that breed later populations of stars. In particular it indicates why stars with mass exceeding approximately 300 solar masses are extremely rare at best. In general, the Eddington limit is only important for very massive stars. Radiation pressure is controlled by the opacity of the surrounding environment. For a fully ionized gas, Thomson scattering provides an opacity of 0.04 m2 / kg. For environments experienced by later populations of stars, dust increases the opacity by absorbing photons as well as scattering them. This is a fairly complex subject. Several good references include the slides at http://jila.colorado.edu/~pja/astr3730/lecture18.pdf and Wikipedia as always.
The next two charts plot stellar luminosity and lifetime and their effect on the enrichment of successive populations of stars. Stellar luminosity increases with stellar mass as shown in this graph that encompasses stars ranging from less than 0.1 solar masses to over 300 solar masses. The black dots are observed stars. The Sun s mass and luminosity are both unity on the two axes. The lines plot luminosity-mass models as power laws of star mass ranging from linear to fourth power depending on star mass. The linear model is a good fit for our sample of giant stars, at least on a log-log scale, but the 2.3 power law does not seem to fit our limited sample of dwarf stars. The model of stellar lifetime is proportional to the ratio of mass to luminosity. Even though massive stars have more fuel, they burn it faster and live shorter lives. The Sun s mass and lifetime are both unity on the two axes. On a log-log scale the reported values are a fairly good fit to our set of stars. The longevity of massive stars is millions of years, far less than the ten billion year main sequence lifetime of the Sun.
metal dispersion by supernovas enriches later populations of stars
Cosmic Evolution Lecture Wednesday October 10 at 7 pm Spanos Theatre How we find planets around other stars by Amherst College Astrophysics Professor Kate Follette Dark Matter Day event on Halloween Wednesday October 31 Baker Building The expansion of space transformed a hot dense universe into empty space Dark Matter transformed empty space into stars and galaxies WIMPs form stable halos that can harbor star clusters and galaxies cosmic evolution project website https://evolution.calpoly.edu/ principal investigator Dr. Bob Field rfield@calpoly.edu this poster is available as a pdf at https://evolution.calpoly.edu/projects
a few references https://arxiv.org/pdf/1508.01525.pdf Haider et al Large-scale mass distribution in the Illustris simulation https://academic.oup.com/mnras/article/417/1/154/979166 stellar disk and spheroid formation simulations http://www.vikdhillon.staff.shef.ac.uk/teaching/phy213/phy213_equations.html, Stellar Structure Equations http://www.astro.utu.fi/~cflynn/galdyn/lecture2.html, Stellar Population numbers http://www.astro.yale.edu/larson/papers/SciAm04.pdf, Yale Population III numbers https://arxiv.org/pdf/astro-ph/0311019.pdf, Population III first star formation http://cfas.org/data/uploads/astronomy-ebooks/evolution_of_stars_and_stellar_populations.pdf, Pop II star numbers https://physics.stackexchange.com/questions/6771/star-surface-temperature-vs-mass, Stellar Traits Model Equations. http://jila.colorado.edu/~pja/astr3730/lecture18.pdf, Eddington Limit https://arxiv.org/pdf/0802.1675.pdf, effect of Z on stars ( low Z) https://www.cfa.harvard.edu/news/su201747, We still do not know exactly what determines a star s initial mass. https://arxiv.org/pdf/1312.5326.pdf, Initial Mass Function http://iopscience.iop.org/article/10.1086/513063/fulltext/, Supernova Metal Dispersion Data acknowledgements Thanks to Bill Frost and the Cal Poly Frost Summer Research Program for giving our three students the opportunity to investigate the formation and evolution of galaxies and populations of stars.


 shows the")