Visual Insights into Time Use and Development Indicators Across Different Countries
Explore a collection of images showcasing data on daily time use in Peru, India, and Vietnam, along with comparative math presentations on country gaps and measuring development indicators. Delve into analyses of urban vs. rural time use, gender differences, and fairness considerations. Gain insights into various aspects of development and social disparities through engaging visual presentations.
- Time use data
- Development indicators
- Comparative analysis
- Gender differences
- Urban vs. rural
- Visual presentations

Download Presentation

Please find below an Image/Link to download the presentation.
The content on the website is provided AS IS for your information and personal use only. It may not be sold, licensed, or shared on other websites without obtaining consent from the author. Download presentation by click this link. If you encounter any issues during the download, it is possible that the publisher has removed the file from their server.
E N D
Presentation Transcript
MORE OR LESS EQUAL? Maths slideshow B
MATHS 4 In-country gaps 2
PRESENTING TIME USE DATA Eva, Peru Pie chart
PRESENTING TIME USE DATA Eva, Peru Bar chart
PRESENTING TIME USE DATA Eva, Peru Line graph
PRESENTING TIME USE DATA Eva, Peru Table Tasks on family farm or business Work for pay outside of household Studying outside of school Play or leisure activities Caring for others Domestic tasks Activity type Sleeping At school Daily time use (hours) 10 4 3 0 0 4 3 1
Eva Peru
Sarada India
HMai Viet Nam
TIME TO THINK What similarities and differences in daily time use are there between young people living in urban and rural areas? What similarities and differences in daily time use are there between boys and girls? What do you think are the reasons for some of these similarities and differences? Do you think the differences are fair?
MATHS 5 Between-country gaps
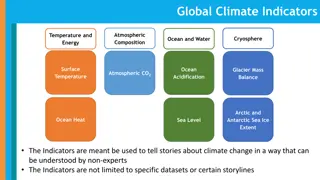
MEASURING DEVELOPMENT Average income per person Access to water Life expectancy Infant mortality rate Access to electricity Primary school enrolment
MEASURING DEVELOPMENT Number of doctors per 1000 people CO2 emissions Gender equality Mobile phone subscriptions Percentage living in extreme poverty Internet users
PRIMARY SCHOOL ENROLMENT In Peru, 92% of young people are enrolled in primary school. I moved to the city from my village earlier this year so that I could start secondary school. Elmer
ACCESS TO DRINKING WATER In India, 94% of people have access to an improved drinking water source. We have to collect our water in pots from a street tap at the back of our house. Harika
ACCESS TO SANITATION FACILITIES In Ethiopia, 28% of people have access to improved sanitation facilities. The average in the urban Young Lives communities, such as Netsa s, is 52%. In my school there is one toilet for grades 5 to 8, but it doesn t work properly. Netsa
ACCESS TO ELECTRICITY In Viet Nam, 99% of people have access to electricity. The Young Lives researchers have found that average access to electricity is lower for people from ethnic minority groups (like H Mai) than for people from the ethnic majority group (Kinh), though this gap has got smaller. There isn t any electricity in our house. There is an electricity supply in our village but we can t afford the connection. I dream of having electricity at home one day. H Mai
MATHS 6 Changing gaps over time
MEASURING DEVELOPMENT Average income per person Access to water Life expectancy Infant mortality rate Access to electricity Primary school enrolment
MEASURING DEVELOPMENT Number of doctors per 1000 people CO2 emissions Gender equality Mobile phone subscriptions Percentage living in extreme poverty Internet users
QUANTITATIVE OR QUALITATIVE? Quantitative data involves numbers and the data is usually analysed using mathematical and statistical methods. Qualitative datadoesn t involve numbers. It might include words, pictures, photographs and/or observations.
TALKING ABOUT CHANGES Hadush Ethiopia The primary schools now have better services for example there are now separate toilets for boys and girls. There is also an improved health centre which has enough beds and medical equipment. More people now have mobile phones. There is improved irrigation and farmers are now using motor irrigation pumps to help them to grow vegetables and grains. Yisak Tafere
TALKING ABOUT CHANGES Salman India The buildings of the local secondary school have improved: there are new windows and doors, freshly painted walls, a new girls bathroom and a computer room. New classrooms have also been built in the primary school. Children now get a free midday meal each day at secondary school as well as primary school. New roads have been built and rubbish is now being cleared regularly. Most of the households now have mobile phones. Dr Uma Vennam
TALKING ABOUT CHANGES Eva Peru Although most people have electricity and piped water available in the yard outside their house, many people still do not. Since 2011 there has been increased mobile phone access, as well as more public phones and an Internet booth. A public health post has been built in the village with a nurse and a doctor working there every day. A new road has been constructed which means that it is now quicker to get to the nearest public hospital. Vanessa Rojas Arangoitia
TALKING ABOUT CHANGES H Mai Viet Nam There have been many changes in this community. An electricity grid has been installed which has made life much better than before. Nearly all homes now have electricity and more and more people are using the Internet. More roads have been constructed, making transport between villages easier. A new primary school and kindergarten have been built in the local area, which means that children don t have to travel so far to school. Vu Thi Thanh Huong
GDP PER CAPITA (US$) Country 1965 1970 1975 1980 1985 1990 1995 2000 2005 2010 Ethiopia - - - - 233 253 134 124 162 342 India 122 115 161 272 303 375 382 452 729 1,388 Peru 433 542 1078 1,017 824 1,178 2,163 1,967 2,714 5,056 Vietnam - - - - 239 98 288 433 699 1334 UK 1,851 2,348 4,300 10,032 8,652 19,095 21,296 26,296 39,935 38,362


")