Analyzing Success Rates and Disproportionate Impact in Academic Courses
The analysis delves into courses with low success rates, examining factors contributing to outliers and equity implications. Courses like XXXXB1A and XXXXB36 show historically poor success rates. Additionally, disproportionate impacts are observed among Black, Asian, Hispanic, and White students. The study highlights the relationship between success rates and persistence, stressing the importance of academic rigor in course design. Various approaches to enhancing success rates are explored for future improvement in student outcomes.

Download Presentation

Please find below an Image/Link to download the presentation.
The content on the website is provided AS IS for your information and personal use only. It may not be sold, licensed, or shared on other websites without obtaining consent from the author. Download presentation by click this link. If you encounter any issues during the download, it is possible that the publisher has removed the file from their server.
E N D
Presentation Transcript
Guided Pathways Pillars III & IV: Success Rates Craig Hayward Rebecca Farley Helen Acosta College Council 9/16/2022
Overview Which courses have unusually low success rates? Success rates are the count of A, B, C, CR divided by all awarded grades (including withdrawals) Why are these courses outliers? Is it something inherent in students? Or is it something under our control that would be amenable to change (e.g., course structure, modality, grading systems, pedagogy, support options) Benchmarking may provide insights Study practices and approaches of colleges with higher success rates Equity implications associated with low success rates How do success rates relate to persistence? What is the role of rigor?
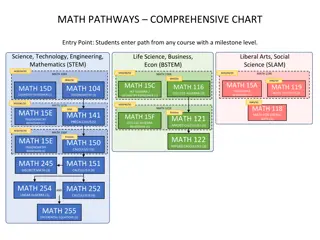
Courses with low success Rates Courses with Historically Low Success Rates and High D,F,W rates Course ID XXXXB1A XXXXB32 XXXXB1AL XXXXB1AL XXXXB1L XXXXB36 Success Rate 43.2% 42.5% 37.0% 44.3% 27.0% 39.4% Enrollments 3042 2683 1664 544 423 386 Successes 1313 1139 616 241 114 152 Non-successes 1729 1544 1048 303 309 234 Courses must have had at least 150 enrollments over four years to be included Terms included in analysis: Summer 2017 through Fall 2020
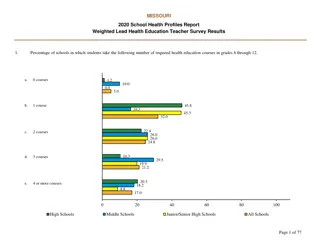
Disproportionate Impact Analysis (Equity) Courses with Historically Low Success Rates and High D,F,W rates Course ID XXXXB1A XXXXB32 XXXXB1AL XXXXB1AL XXXXB1 XXXXB36 Black 33.8% 34.2% 29.30 35.3% 55.6% 38.5% Asian 59.2% 63.6% 36.0% 69.6% 40.0% 50.0% Latinx 41.3% 39.3% 35.3% 40.1% 21.4% 33.5% White 47.0% 50.2% 55.3% 51.0% 32.0% 50.9% Courses must have had at least 150 enrollments over four years to be included Terms included in analysis: Summer 2017 through Fall 2020
Disproportionate Impact Heat Map Black Asian Hispanic White XXXXB1A 33.8% 59.2% 41.3% 47.0% XXXXB32 34.2% 63.6% 39.3% 50.2% XXXXB1AL 29.3% 36.0% 35.3% 55.3% XXXXB1AL 35.3% 69.6% 40.1% 51.0% XXXXB1 55.6% 40.0% 21.4% 32.0% XXXXB36 38.5% 50.0% 33.5% 50.9%
The Relationship of Success/Non-Success to Persistence is Strong Fall to Spring Persistence 76% 80% 70% 60% 50% 40% 30% 24% 20% 10% 0% 0% DFW 100% DFW
Academic Rigor and Success Rates Definition can be ambiguous Some concepts of academic rigor salute high failure rates as an indication of rigor High expectations + time-honored teaching methods (e.g., Sage on the stage ) More recent conceptualizations of academic rigor focus on setting high expectations and ensuring students have clarity on how to effectively meet those expectations. Emphasizes the rigor of one s teaching methodology Variety of engaging approaches that allow students to develop and then build upon knowledge & skills Flipped classrooms, project-based learning, frequent low-stakes assessment, feedback, etc.


")