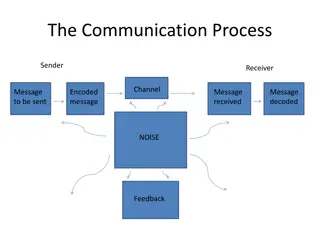
Understanding Research Methods in Communication Science

Explore the world of research inquiry, basic tools of communication science, types of surveys, survey methods, advantages and limitations of survey research, and experimental methods in communication science. Discover various survey types, contact methods, and experimental traditions pioneered by psychologists in communication research.

Download Presentation

Please find below an Image/Link to download the presentation.
The content on the website is provided AS IS for your information and personal use only. It may not be sold, licensed, or shared on other websites without obtaining consent from the author. Download presentation by click this link. If you encounter any issues during the download, it is possible that the publisher has removed the file from their server.
E N D
Presentation Transcript
Research Inquiry
Basic Tools of Communication Science Surveys Experiments Field (or natural ) experiments Social network analysis Content analysis Focused interviews Qualitative Field Research
Types of Surveys Polls (descriptive surveys) Census (full population) Sample surveys (specific group_ Probability sample survey Each member of population has an equal chance of being selected in sample representativeness Permits generalizations about larger population
Survey Types Cross-sectional One time snapshot of the population Panel surveys People re-interviewed over time Measures: Change over time Change in response to some event
Contact Methods in Survey Research Face-to-face Paper and pencil Telephone Direct mail Mall intercept Web-based
Advantages of Survey Research Describing characteristics of a large population Flexibility: Permits measurement of many variables Open and closed-ended questions Capturing a large amount of information on: Cognitions (thoughts), attitudes and behaviors Possibility for anonymous response
Limitations of Survey Research Structuring responses: round pegs into square holes pseudo-opinions Often asks about opinions without context General attitudes rather than more concretely applied to real situations Artificiality of responding to survey Demand characteristics, social desirability, conscious of observation
Experimental Methods Tradition started by psychologists interested in media: Adapted experimental methodology to communication Many early researchers were psychologists For example, Carl Hovland Why We Fight US Army commissions research during WWII Effects of Frank Capra s motivational film series Experimental vs. control group Exp group had more knowledge, but not more motivation
Experiments Experiments provide control to: Test hypotheses Isolate cause and effect Independent and dependent variables Eliminate influence of third variables Explanation over description Simple models: Pretest Stimulus Posttest Experimental vs. control groups
Value of Experiments Isolating cause and effect Exp vs. Control group All other factors are controlled Facilitates causal inferences
Limitations of Experiments Narrow focus Limited number of variables at once Artificial situation Subjects are aware they are being observed Limited external generalizability Best at isolating short-term effects Many media effects are long-term How long do experimental effects last?
Field (Natural) Experiments Experiments that take place in the real world By design: Public health campaign: intervention vs. control community By coincidence: Naturally occurring phenomenon E.g., Comparing Northern Jersey to Southern Jersey in terms of voter turnout due to differing media conditions
Advantages of Field Experiments Approximating control of experiment Less artificial setting Some control is sacrificed for greater generalizability
Social Network Analysis Study of social networks Understand social structure as made of nodes that are tied to one another in terms of strength, duration, frequency, quality, or some other feature. Nodes are usually individuals or organizations Ties can be any property of the relationships between nodes Social networks operate on many levels From families up to the level of nations
Social Network Metrics Centrality: This measure gives a rough indication of the social power of a node based on how well they "connect" the network. Are they a hub or a spoke? Closeness: This measures gives a sense of whether a node is near all other nodes in a network (directly or indirectly). How far along the "grapevine ? Cohesion: This measures the degree to which nodes are connected directly - cliques if every nodes is directly tied to every other one, social circles if nodes are directly and indirectly tied to each other. In-Degree and Out-Degree: The count of the number of ties to other nodes in the network ties coming in vs. ties going out
Content Analysis Systematic analysis of media texts, programs, etc. Design coding instrument with content variables to be measured More than one coder analyzes content Codings compared to ensure reliability
Advantages of Content Analysis Systematic analysis of content Non-obtrusive Reliability easy to assess Do two observers reach the same conclusion?
Limitations of Content Analysis Hard to get at deep meaning of content Mundane questions emphasized for reliable measurement More interesting concepts are hard to measure reliably E.g., media bias
Focused Interviews Trying to get a more in-depth look at opinion holding More open-ended questions Focus groups: Planned discussions in an open-environment Loosely-structured script with moderator 6 to 12 participants Samples usually not randomly selected 1 to 2 hours Qualitative and quantitative analysis of transcript Often combined with surveys of participants
Functions of Focus Groups Prior to survey research: Identifying closed-ended survey items Suggesting hypotheses E.g., Media uses and gratifications-sought Supplementing survey research Going in-depth, behind the survey responses E.g., Attitudes toward affirmative action Getting at complex opinion/belief structures More detailed responses Subjects use their own language, terms, concepts
Limitations of Focus Groups Influence of the facilitator Influence of vocal participants Small, non-representative groups Biases in transcript interpretation Artificial nature of focus group situations Ditto for surveys and experiments
Qualitative Field Research Naturalism detailed and accurate description Grounded Theory patterns and themes from observational work Case Study and Extended Case Method focus on case and cases Ethnography participant and observer of the situation Participatory Action Research Serve as resource for studied group
Stages in the Research Process Interest/initial exploration Conceptualization Choice of method Operationalization Population definition Observation Data processing and analysis Application
Interest/Initial Exploration Interest => preliminary exploration What do we currently know? Applicable research and theory Define purpose/goals: Exploration, description or explanation?
Conceptualization What are the research questions? Who or what do they apply to? Identifying relevant concepts What concepts/variables come into play? Define all important concepts E.g., Racial prejudice, political participation How do we define them?
Choice of Method Best method to answer research questions? Content analysis? Lab experiment? Field experiment Natural experiment? Focus groups? Survey? Cross-sectional, trend, cohort, or panel?
Operationalization How do we measure concepts? E.g., Measuring attention to media How has past research measured concepts? What is best for our purposes?
Population Definition To whom do we want to generalize results? Define the population of units Define sampling frame (population list) Who are we going to study? Define sampling strategy for selection Should represent larger population
Observation Making observations/collecting data For example: Survey interviewing Content analysis coding Taping focus group interactions Experimental observations
Data Processing and Analysis Data processing Translating the observations into data E.g., survey answers translated into numbers and entered into the computer E.g., content coded into numbers Data analysis Synthesizing larges amounts of information Data analysis examining relationships b/w concepts Application of statistics and summary tables
Application Packaging the results in usable form Writing a research report: Who is the audience? Researchers, policymakers or public
Contexts of Communication Research A. Advertising B. Public Relations C. Marketing D. Public Opinion E. Political Campaigns F. Health Communication G. Research Consulting H. Interest Group Research I. Academic Research
Becoming a competent researcher Mastering basic concepts and principles Following systematic procedures Striving for objectivity Having good research questions Using the right tool to answer the question Testing underlying explanations Learning by doing - Applied approach to learning research methods
2016 Rolling Cross Sectional Study Collected from September 20 to November 7, 2016. The survey sample included about 100 respondents per day, using quota sampling from Qualtrics online panel to approximate U.S. Census data regarding age, race, education, and income. Each day consisted of a new sample, resulting in a final sample of 4,901 respondents over 49 days. Candidate feeling thermometer ratings Emotional reactions to candidates Candidate and political party characteristics Political knowledge (rolling current events) Attention to campaign News perceptions Political attitudes Vote certainty (before election) Vote choice and experience (after election) Liberal media Conservative media Social media use Popular stories on social media (rolling current events) Legacy news media Local news media Political conversation and social network Social media and news attitudes Political advertising exposure and reactions Confidence in election/belief in election fraud Partisanship, Ideology, and Issue Positions Demographics
2018-2019 Swing State Panel From October 26 to November 4, 2018, the first wave of a web-based, two-wave panel survey of registered voters in Wisconsin (N=2,058), Ohio (N=396), Michigan (N=391), North Carolina (N=369), and Pennsylvania (N=391), was collected. In wave two, launched in February of 2019, we were able to successfully recontact a subset of the same respondents in Wisconsin (N=1,058), Ohio (N=156), Michigan (N=121), North Carolina (N=133), and Pennsylvania (N=150). Respondents were recruited as part of an online panel by LHK Partners, a national survey research firm, using a nested quota sampling procedure stratified by age, gender, and race based on Census data from each state. Group closeness and social trust Institutional confidence Political participation Political talk and news networks Political conversation and online network Vote intention News perceptions Political attitudes Political efficacy Liberal media Conservative media New avoidance/fatigue Social media use Legacy news media Local news media News diet Media trust Candidate favorability and approval Religious traditionalism/modernism Racial resentment Campaign enthusiasm Partisanship, Ideology, and Issue Positions Demographics + Experiments!!!
2020-2021 Wisconsin-Pennsylvania Panel From October 21 to November 1, 2020, the first wave of a web-based, two-wave panel survey of registered voters in Wisconsin (N=3,076), Michigan (N=1,589), North Carolina (N=1,621), and Pennsylvania (N=1,751), was collected. In wave two, fielded from December 7, 2020 to December 15, 2020, we were able to successfully recontact a subset of the same respondents in Wisconsin and Pennsylvania (N= 1,849). Respondents were recruited as part of an online panel by LHK Partners, a national survey research firm, using a nested quota sampling procedure stratified by age, gender, and race based on Census data from each state. Group closeness and social trust Institutional confidence Political participation Political conversation and online network Vote intention News perceptions Political attitudes Liberal media Conservative media New avoidance/fatigue Social media use Legacy news media Local news media Media trust Candidate favorability and approval Health status, need for chaos, elitism Hostile sexism, materialism \/post-materialsim Racial resentment Campaign enthusiasm Partisanship, Ideology, and Issue Positions Cultural taste/religious traditionalism/modernism Occupation Demographics + Experiments!!!
Getting into teams Will be joining a team of 3-4 people to work on the group project Exchange contact info (e.g., university email), discuss common workspaces (e.g. BOX, Google docs), and schedules. Share your general interests and start discussion of project aims. Do not need to land on a specific aim today. Will have class time. Outside class meetings (online) in weeks 4 and 9. In class workshop sessions throughout the semester. Attendance noted.


 Experiments")