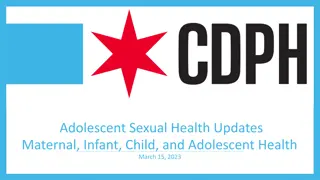
Transforming Adolescent Health Outcomes: A Holistic Approach
Dr. Hayley Lofink Love, PhD, advocates for rethinking healthcare to address adolescent health challenges by leveraging school-based health centers. The current system is failing to meet adolescents' needs due to fragmented care and incomplete services. By providing convenient, culturally appropriate, and confidential care, we can address issues such as teen pregnancy, substance use, and school failure, preventing long-term threats like obesity and involvement in the criminal justice system. Embracing a broader concept of healthcare involving nontraditional team members can realign health services to better address nonclinical determinants affecting adolescents' well-being.

Download Presentation

Please find below an Image/Link to download the presentation.
The content on the website is provided AS IS for your information and personal use only. It may not be sold, licensed, or shared on other websites without obtaining consent from the author. Download presentation by click this link. If you encounter any issues during the download, it is possible that the publisher has removed the file from their server.
E N D
Presentation Transcript
Improving Adolescent Health Outcomes Hayley Lofink Love, PhD Director, Research and Evaluation School-Based Health Alliance
Agenda 1. Adolescent health challenges 2. Rethinking healthcare 3. School-based health centers as a solution
Fragmented care Emergency department use Incomplete care Duplicated care current health care system is failing to meet the needs of adolescents
Convenient AccessibleCulturally and developmentally appropriate CONFIDENTIAL adolescent-centered care
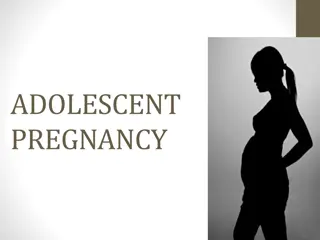
Teen pregnancy Substance use and addiction Violence/trauma School failure Inter-related Costly Preventable Long-term threats to health and wellbeing
risk for obesity, alcoholism, depression Level of school engagement Early pregnancy School performance Adverse childhood experiences
Involvement in criminal justice system Lifetime earnings Health outcomes Death rate School failure
Product: broaden concept to ameliorate effects of nonclinical determinants (Inadequate food, housing, safety) Place: beyond medical complex in neighborhoods Provider: nontraditional team members (Community outreach workers, heath educators, coaches, resource coordination) Realigning health with care Rebecca Onie, Paul Farmer, & Heidi Behforouz. Realigning Health with Care. Stanford Social Innovation Review
The evolving health care system 3.0 Wellness/ prevention Achieving optimal health for all 2.0 Chronic disease Prolonging disability-free life 1.0 Acute/ infectious disease Reducing deaths Halfon, Wise, Forrest. The Changing Nature Of Children's Health Development: New Challenges Require Major Policy Solutions Health Aff December 201433:122116-2124
1. Point of entry to primary prevention, risk reduction and care management system 2. Inter-disciplinary team: whole child approach that unifies mind and body 3. Screen/address behavioral health needs often undetected and unmet by mainstream PC system 4. Meets young people where they are (literally) in terms of problems, pain, social and developmental challenges 5. Unprecedented opportunity for population health Schools in the health neighborhood
1. Provide quality, comprehensive health care services that help students succeed in school and in life. 2. Located in or near a school facility and open during school hours. 3. Organized through school, community, and health provider relationships. 4. Staffed by qualified health care professionals. 5. Focused on the prevention, early identification, and treatment of medical and behavioral concerns that can interfere with a student s learning. School-based health center characteristics
SBHCs: The Evidence Base 1. Increased use of primary care 2. Reduced inappropriate emergency room use Greater than 50% reduction in asthma-related emergency room visits for students enrolled in NYC SBHCs 3. Fewer hospitalizations $3 million savings in asthma-related hospitalization costs for students enrolled in NYC SBHCs 4. Access to harder-to-reach populations - esp minorities and males Adolescents were 10-21 times more likely to come to a SBHC for mental health services than a CHC or HMO. SBHCs: The Evidence Base
More than More than 2000 SBHCs 2000 SBHCs 49 of 50 states 49 of 50 states and in DC and in DC
Locations of SBHCs Nationwide (n=1930) Puerto Rico & Virgin Islands Hawaii Alaska Marshall Islands
SBHC Sponsor Agency (n=1341) 33.4% Community health center 26.4% Hospital/medical center 13.3% Local health department 11.3% School system 6.3% Private, non-profit 4.2% Other 3.6% University 1.3% Mental health agency 0.3% Tribal government 0% 5% 10% 15% 20% 25% 30% 35%
> 31 HOURS/WEEK AFTER SCHOOL BEFORE SCHOOL 66.6 66.6% 73.1 73.1% 60.8 60.8% % % % (n=1295) (n=1284) (n=1285)
Primary Primary Care Care Mental Mental Health Health Oral Oral Health Health 100% (n=1381) % 70.8% (n=978) % 15.9% (n=219) Provider Types in SBHCs % Nursing or Nursing or Clinical Clinical Support Support 85.8% (n=1185) % Health Health Educator Educator 16.0% (n=221) % 10.7% (n=148) % Dietician Dietician
SBHC Staffing Profiles (n=1381) 29.2 29.2% % Primary Care 33.4 33.4% % Primary Care & Mental Health 37.4 37.4% % Primary Care & Mental Health Plus
Mental Mental Health Health Oral Oral Health Health Reproductive Reproductive Health Health Vision Vision Screening Screening Injury and Injury and Violence Violence Prevention Prevention Immunizations Immunizations Alcohol, Alcohol, Healthy Eating, Healthy Eating, Active Living, and Active Living, and Weight Management Weight Management Tobacco, and Drug Tobacco, and Drug Use Prevention Use Prevention
70.6% 70.6% have a pre-arranged source of after-hours care 52.7 52.7% use electronic health or medical records (EHR/EMR) %
Revenue Supporting SBHCs (not including in-kind donations) (n=1286) 74.7% State Government 53.4% Federal Government Private Foundations 40.4% School/School District 33.1% Hospital 32.6% County/City Govt. 32.3% 27.4% MCO/Private Insurer 18.4% Corps./Businesses SBHA 6.6% State Network/Assoc. 5.1% Tribal Government 1.1% 0% 10% 20% 30% 40% 50% 60% 70% 80% 90% 100%
87.9 87.9% % report billing at least one insurance program (n=1272)
Patient Revenue by Source 85.9 85.9% 64.0 64.0% % % Public Sources (n=1273) Private Sources (n=1300) 50.0 50.0% % Self-pay (n=1309)
81.6 81.6% 71.4 71.4% % State Medicaid Agency (n=1309) 64.0% 64.0% % Medicaid MCOs (n=1311) 63.0 63.0% % CHIP (n=1307)
2500 2000 % % 1500 1000 Grow the number of SBHCs by 2018 Grow the number of SBHCs by 2018 500 0 1987 1988 1993 1997 1999 2002 2005 2009 2011 2014
% % SBHCs to document performance standards SBHCs to document performance standards
Contact information: Hayley Lofink Love hlofink@sbh4all.org


")
")