Health and Health Care for American Indians and Alaska Natives in the United States

American Indians and Alaska Natives (AIANs) in the United States face unique health challenges, with disparities in health outcomes compared to Whites. Despite the services provided by the Indian Health Service (IHS), AIANs continue to experience poorer health status. The population accounts for 2% of the U.S. population, with over 5 million individuals identifying as AIAN. Issues include higher rates of poverty, lower full-time employment, and worse health measures. Improving health coverage and addressing funding gaps in IHS are crucial to addressing these disparities.

Download Presentation

Please find below an Image/Link to download the presentation.
The content on the website is provided AS IS for your information and personal use only. It may not be sold, licensed, or shared on other websites without obtaining consent from the author. Download presentation by click this link. If you encounter any issues during the download, it is possible that the publisher has removed the file from their server.
E N D
Presentation Transcript
Health and Health Care for American Indians and Alaska Natives (AIANs) in the United States Updated May 2019
Figure 1 AIANs account for 2% of the United States population. As of 2017, over 5 million individuals self-identify as AIAN alone or in combination with another race. Under treaties and laws, the U.S. has a unique responsibility to provide certain rights, protections, and services to AIANs, including health care. Source: Kaiser Family Foundation analysis of 2017 American Community Survey (ACS), 1-Year Estimates.
Figure 2 AIANs live across the United States, but 60% reside in 11 states. The majority of AIANs live outside of tribal areas. SHARE OF AIAN POPULATION BY STATE, 2017 CA 14% OK 10% Remaining States 40% AZ 7% TX 6% NM 4% WA 4% FL 3% NY 4% NC 3% MI 3% AK 3% Total: 5.4 Million Note: AIAN includes people of mixed race and of Hispanic origin. Source: Kaiser Family Foundation analysis of 2017 American Community Survey (ACS), 1-Year Estimates.
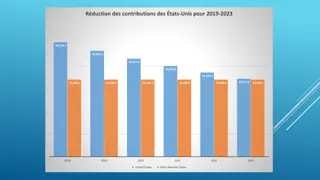
Figure3 Nonelderly AIANs are younger, more likely to be poor, and less likely to have a full-time worker in the family compared to Whites. AIAN White 84% 70% 57% 49% 23% 8% 34 and Younger Family Income Below Poverty Full-Time Worker in Family Note: AIANs and Whites are non-Hispanic. Excludes individuals of mixed race. Includes nonelderly individuals 0-64 years of age. All values have a statistically significant difference from the White population at the p<0.05 level. Source: Kaiser Family Foundation analysis of 2017 American Community Survey (ACS), 1-Year Estimates.
Figure4 AIANs fare worse than Whites across many health measures. AIAN White 40%* 37% 32% 31%* 30% 20% 17%* 15%* 15%* 14%* 10% 10% 9% 7% Fair or Poor Health Status Physical Limitation Obese Current Smoker Currently Has Asthma Told By Doctor They Have Diabetes Substance Use Disorder Among Ages 12+ * Indicates statistically significant difference from the White population at the p<0.05 level. Note: AIANs and Whites are non-Hispanic. Excludes individuals of mixed race. Includes nonelderly adults 18-64 years of age. Source: Kaiser Family Foundation analysis of 2017 National Health Interview Survey (NHIS), 2017 Behavioral Risk Factor Surveillance System (BRFSS), and 2017 National Survey on Drug Use and Health.
Figure5 Although the Indian Health Service (IHS) provides services to AIANs, health coverage is important for AIANs. IHS is the primary vehicle through which the federal government provides health services to AIANs. IHS has historically been underfunded to met the health care needs of AIANs. Enrolling AIANs in health coverage, including Medicaid or Marketplace coverage, expands their access to services and increases revenues to IHS and Tribal facilities. Source: Kaiser Family Foundation Program on Medicaid and the Uninsured, Medicaid and American Indians and Alaska Natives, (Washington, DC: Kaiser Family Foundation, September 2017), http://files.kff.org/attachment/issue-brief-medicaid-and-american- indians-and-alaska-natives.
Figure6 Medicaid and CHIP help fill gaps in private coverage for AIANs, particularly AIAN children, but they remain more likely to be uninsured than Whites. 4% 8% 14% 26% Uninsured 30% 68% Employer/ Other Private 75% 42% 56% Medicaid/ Other Public 32% 28% 16% AIAN Nonelderly Adults (19-64) White AIAN White Children (0-18) Note: AIANs and Whites are non-Hispanic. Excludes individuals of mixed race. Includes nonelderly adults 19-64 years of age and children 0-18 years of age. Totals may not sum to 100% due to rounding. All values have a statistically significant difference from the White population at the p<0.05 level. Source: Kaiser Family Foundation analysis of 2017 American Community Survey (ACS), 1-Year Estimates.
Figure7 AIANs have Gained Coverage Under the Affordable Care Act, with Larger Increases in States that Expanded Medicaid. HEALTH INSURANCE COVERAGE FOR NONELDERLY AIANs BY EXPANSION STATUS, 2013 & 2017 20% 26% Uninsured 29% 31% 35% Employer/ Other Private 43% 33% 40% Medicaid/ Other Public 45% 36% 31% 30% 2013 2017 2013 2017 Expansion States Non-Expansion States Note: AIANs are non-Hispanic. Excludes individuals of mixed race. Includes nonelderly individuals 0-64 years of age. Source: Kaiser Family Foundation analysis of the 2013 & 2017 American Community Survey (ACS), 1-Year Estimates.