Housing Landscape in North Dakota: Analysis and Demographics
Explore the fair housing protections, analysis of impediments, and demographic data for the state of North Dakota. Understand the racial, ethnic, age, and gender distributions within the population as well as factors affecting housing accessibility and equality.

Download Presentation

Please find below an Image/Link to download the presentation.
The content on the website is provided AS IS for your information and personal use only. It may not be sold, licensed, or shared on other websites without obtaining consent from the author. Download presentation by click this link. If you encounter any issues during the download, it is possible that the publisher has removed the file from their server.
E N D
Presentation Transcript
2020-2024 State of North Dakota Analysis of Impediments Sponsored by North Dakota Department of Commerce Welcome to the Public Review Meeting! April 21, 2020
Fair Housing Protections Fair Housing Protections Federal and State Fair Housing Acts protect several groups in housing transactions. These are: Race, color, religion, national origin, sex, disability, and familial status
North Dakota Analysis of Impediments (AI) Entitlement jurisdictions must: Certify that they are affirmatively furthering fair housing (AFFH) as a condition of receiving federal funds for housing from HUD
RCAP: Racially Concentrated Areas of Poverty HUD s Fair Housing Issues 1. Segregation analysis 2. RCAP and ECAP evaluation 3. Disparities in access to opportunity 4. Disproportionate housing needs 5. Publicly supported housing analysis 6. Disability and access analysis 7. Fair housing enforcement, outreach, etc. ECAP: Ethnically Concentrated Areas of Poverty
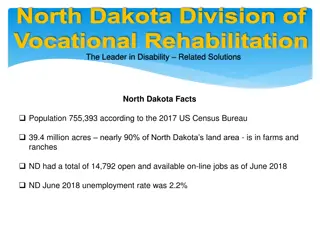
Demographics Population Estimates State of North Dakota 2010-2018 Census Data and Intercensal Estimates 2010 Census 2011 Population Estimate 2012 Population Estimate 2013 Population Estimate 2014 Population Estimate 2015 Population Estimate 2016 Population Estimate 2017 Population Estimate 2018 Population Estimate 672,591 685,136 701,116 721,999 737,382 754,022 754,353 755,176 760,077
Demographics Population by Age and Gender State of North Dakota 2010 Census and Current Census Estimates 2010 Census 2018 Estimates % Change Age 18-Oct 22.60% 4.20% 26.90% 20.10% -17.20% 15.90% 13.00% Under 14 years 15 to 24 years 25 to 44 years 45 to 54 years 55 to 64 years 65 and Over Total 124,461 106,430 90,485 75,262 96,657 81,819 672,591 152,549 110,861 114,800 90,402 80,005 94,823 760,077
Demographics Population by Race and Ethnicity State of North Dakota 2010 Census & 2018 Five-Year ACS 2010 Census 2018 Five-Year ACS Population 655,268 20,445 39,462 10,814 378 7,528 18,306 752,201 725,672 26,529 Race Population 605,449 7,960 36,591 6,909 320 3,509 11,853 672,591 659,124 13,467 % of Total 90.0% 1.2% 5.4% 1.0% 0% 0.5% 1.8% 100.0% 98.0% 2.0% % of Total 87.1% 2.7% 5.2% 1.4% 0.1% 1.0% 2.4% 100.0% 96.5% 3.5% White Black American Indian Asian Native Hawaiian/ Pacific Islander Other Two or More Races Total Non-Hispanic Hispanic
Economics Households by Income State of North Dakota 2010 & 2018 Five-Year ACS Data 2010 Five-Year ACS 2018 Five-Year ACS Income Households % of Total Households % of Total Less than $15,000 $15,000 to $19,999 $20,000 to $24,999 $25,000 to $34,999 $35,000 to $49,999 $50,000 to $74,999 $75,000 to $99,999 $100,000 or More Total 39,425 16,011 16,678 32,772 41,563 55,089 34,795 40,309 276,642 14.3% 5.8% 6.0% 11.8% 15.0% 19.9% 12.6% 14.6% 100.0% 31,291 13,158 12,633 27,910 39,929 57,047 45,061 87,874 314,903 9.9% 4.2% 4.0% 8.9% 12.7% 18.1% 14.3% 27.9% 100.0%
Economics Poverty by Age State of North Dakota 2000 Census SF3 & 2018 Five-Year ACS Data 2000 Census 2018 Five-Year ACS Persons in Poverty 8,604 12,258 48,920 9,488 79,270 10.9% Age Persons in Poverty 8,173 13,990 41,568 9,726 73,457 11.9% % of Total 10.9% 15.5% 61.7% 12.0% 100.0% . % of Total Under 6 6 to 17 18 to 64 65 or Older Total Poverty Rate 11.1% 19.0% 56.6% 13.2% 100.0% .
Economics Poverty Rates State of North Dakota SAIPE Estimates 2000 2017
Economics Annual Unemployment Rate State of North Dakota 1990 2018 BLS Data
Economics Real Average Earnings per Job State of North Dakota
Housing Housing Units by Type State of North Dakota 2010 & 2018 Five-Year ACS Data 2010 Five-Year ACS Units 208,028 7,192 12,538 61,360 23,719 2018 Five-Year ACS Units 231,666 7,608 14,120 87,402 26,767 Unit Type % of Total 66.5% 2.3% 4.0% 19.6% 7.6% % of Total 63.0% 2.1% 3.8% 23.8% 7.3% Single-Family Duplex Tri- or Four-Plex Apartment Mobile Home Boat, RV, Van, Etc. 24 0% 121 0% Total 312,861 100.0% 367,684 100.0%
Housing Housing Units by Tenure State of North Dakota 2010 Census & 2018 Five-Year ACS Data 2010 Census 2018 Five-Year ACS Tenure Units 281,192 % of Total 88.6% Units 314,903 % of Total 85.6% Occupied Housing Units Owner-Occupied 183,943 65.4% 197,347 62.7% Renter-Occupied 97,249 34.6% 117,556 37.3% Vacant Housing Units 36,306 11.4% 52,781 14.4% Total Housing Units 317,498 100.0% 367,684 100.0%
Housing Households by Year Home Built State of North Dakota 2010 & 2018 Five-Year ACS Data 2010 Five-Year ACS Households 44,468 13,577 29,365 30,162 61,690 36,021 32,465 28,894 . 276,642 2018 Five-Year ACS Households 38,564 13,239 28,124 28,934 57,926 36,404 35,167 38,431 38,114 314,903 Year Built % of Total 16.1% 4.9% 10.6% 10.9% 22.3% 13.0% 11.7% 10.4% . 100.0% % of Total 12.2% 4.2% 8.9% 9.2% 18.4% 11.6% 11.2% 12.2% 12.1% 100.0% 1939 or Earlier 1940 to 1949 1950 to 1959 1960 to 1969 1970 to 1979 1980 to 1989 1990 to 1999 2000 to 2009 2010 or Later Total
Housing Disposition of Vacant Housing Units State of North Dakota 2010 Census & 2018 Five-Year ACS Data 2010 Census Units 7,422 2,734 554 1,043 2018 Five-Year ACS Units 12,502 3,054 2,694 1,297 Disposition % of Total 20.4% 7.5% 1.5% 2.9% % of Total 23.7% 5.8% 5.1% 2.5% For Rent For Sale Rented Not Occupied Sold Not Occupied For Seasonal, Recreational, or Occasional Use For Migrant Workers Other Vacant Total 11,483 31.6% 15,898 30.1% 319 12,751 36,306 0.9% 35.1% 100.0% 858 16,478 52,781 1.6% 31.2% 100.0%
Housing Single-Family Permits State of North Dakota Census Bureau Data, 1980 2018
Housing Total Permits by Unit Type State of North Dakota Census Bureau Data, 1980 2018
Housing Median Rent State of North Dakota 2018 Five-Year ACS Data Place Rent Median Rent $722 Median Home Value $185,000
Segregation Interpreting the dissimilarity index Values Dissimilarity Index [range 0-100] Measure Description Low Segregation Moderate Segregation High Segregation <40 40-54 >55 Dissimilarity Index State of North Dakota
Disparities in Access to Opportunity Access to Opportunity Indexes Low Poverty a measure of the degree of poverty in a neighborhood School Proficiency - school-level data on the performance of 4th grade students on state exams to describe which neighborhoods have high-performing elementary schools Jobs Proximity - quantifies the accessibility of a given residential neighborhood as a function of its distance to all job locations
Disparities in Access to Opportunity Access to Opportunity Indexes Labor Market Engagement - provides a summary description of the relative intensity of labor market engagement and human capital in a neighborhood Low Transportation Cost estimates of transportation costs for a family that meets the following description: a 3-person single-parent family with income at 50% of the median income for renters for the region Transit Trips - trips taken by a family that meets the following description: a 3-person single-parent family with income at 50% of the median income for renters Environmental Health exposure to harmful toxins at a neighborhood level - summarizes potential
Disparities in Access to Opportunity Access to Opportunity Indexes
Disparities in Access to Opportunity Mortgage Denial Rates by Race/Ethnicity of Applicant State of North Dakota 2004 2017 HMDA Data Race/Ethnicity American Indian Asian Black Pacific Islander White Not Available Not Applicable Average Hispanic Non-Hispanic 2008 19.5% 3.6% 15.9% 10.0% 8.1% 14.4% 0.0% 8.5% 15.5% 8.2% 2009 16.7% 8.8% 17.0% 11.1% 8.5% 11.7% 0.0% 8.8% 20.5% 8.5% 2010 25.5% 8.0% 3.1% 18.2% 8.5% 13.1% % 8.7% 6.3% 8.6% 2011 20.8% 7.9% 11.8% 0.0% 9.4% 20.4% % 9.9% 15.1% 9.3% 2012 25.0% 18.4% 17.5% 6.2% 9.9% 18.0% 0.0% 10.4% 21.1% 10.1% 2013 28.6% 9.0% 7.5% 13.3% 9.1% 17.8% 0.0% 9.6% 16.7% 9.1% 2014 18.6% 4.8% 11.6% 21.7% 7.4% 21.2% 0.0% 8.1% 7.1% 7.6% 2015 23.1% 7.5% 21.7% 4.8% 8.4% 16.6% 0.0% 9.0% 13.8% 8.6% 2016 14.0% 8.5% 20.0% 16.7% 7.9% 19.0% 0.0% 8.6% 7.1% 8.1% 2017 10.0% 10.8% 21.6% 0.0% 7.1% 18.8% 0.0% 7.9% 10.7% 7.3% 2018 16.1% 10.7% 7.5% 0.0% 5.4% 10.9% 0.0% 6.0% 10.1% 5.4% Average 19.4% 9.0% 14.8% 10.2% 8.2% 16.2% 0.0% 8.7% 12.6% 8.3%
Disproportionate Housing Needs Percent of Total Households with Housing Problems by Income and Race State of North Dakota 2012 2016 HUD CHAS Data Non-Hispanic by Race Hispanic Income American Pacific Other Race(Any Race) Total White Black Asian Indian Islander With Housing Problems 65.1% $0 to $25,350 70.7% 80.6% 65.8% 100.0% 66.2% 82.4% 70.9% $25,351 to $42,250 47.2% 62.6% 66.7% 45.3% 0% 63.6% 64.2% 48.7% $42,251 to $67,600 20.6% 23.1% 23.9% 16.3% 0% 25.4% 32.4% 21.0% $67,601 to $84,500 9.9% 38.2% 4.6% 6.1% 0% 15.7% 10.8% 10.0% Above $84,500 Total 3.1% 20.2% 15.6% 50.7% 8.1% 30.8% Without Housing Problems 10.9% 7.0% 35.00% 0% 6.3% 30.70% 11.6% 40.6% 3.4% 22.0% 37.50% $0 to $25,350 22.6% 10.2% 24.7% 0.0% 32.7% 11.7% 22.0% $25,351 to $42,250 52.8% 37.4% 33.3% 54.7% 0.0% 36.4% 35.8% 51.3% $42,251 to $67,600 79.4% 76.9% 76.1% 83.7% 0.0% 74.6% 67.6% 79.0% $67,601 to $84,500 90.1% 61.8% 95.4% 93.9% 100.0% 84.3% 89.2% 90.0% Above $84,500 Total 96.9% 79.0% 84.4% 46.5% 91.9% 64.2% 93.0% 61.8% 100.0% 62.5% 93.7% 69.2% 88.4% 58.2% 96.6% 77.1%
Disability and Access Disability by Age State of North Dakota 2018 Five-Year ACS Data Male Female Total Age Disabled Population 187 3,847 4,989 15,931 7,279 9,142 41,375 Disability Rate 0.7% 6.2% 4.8% 11.8% 25.3% 47.7% 11.0% Disabled Population 127 1,689 5,376 12,484 6,059 12,234 37,969 Disability Rate 0.5% 2.9% 5.9% 9.7% 20.7% 45.9% 10.5% Disabled Population 314 5,536 10,365 28,415 13,338 21,376 79,344 Disability Rate 0.6% 4.6% 5.3% 10.8% 23.0% 46.7% 10.8% Under 5 5 to 17 18 to 34 35 to 64 65 to 74 75 or Older Total
Disability and Access Residents with Disabilities by Subsidized Housing Type State of North Dakota HUD AFFH Raw Database Total Units Program Total Disabled Units Public Housing 1,807 567 Project Based Section 8 2,917 811 Other HUD Multifamily 208 117 Housing Choice Vouchers 7,879 2,267 Total 12,811 3,762
Fair Housing Complaints Fair Housing Complaints with Cause by Basis State of North Dakota HUD Fair Housing Complaints Basis Disability Familial Status Public Assistance Race National Origin Color Sex Age Marital Status Retaliation Total Basis Total Complaints Total 147 21 16 10 7 4 3 3 2 1 214 199 2008 2009 2010 2011 2012 2013 2014 2015 2016 2017 2018 2019 9 5 1 0 0 0 0 0 0 0 15 15 18 12 3 1 1 0 0 0 0 0 35 36 12 1 1 1 0 1 0 1 0 0 17 17 10 0 0 0 0 1 0 0 0 0 11 11 13 1 2 1 0 0 0 1 0 0 18 18 13 0 0 1 0 0 0 0 0 0 14 14 15 1 0 1 2 1 1 1 1 0 23 23 5 0 0 2 1 0 1 0 0 0 9 9 9 0 2 1 0 0 1 0 0 0 13 13 27 1 2 1 1 0 0 0 1 1 34 34 5 0 3 0 1 0 0 0 0 0 9 9 11 0 2 1 1 1 0 0 0 0 16 16
Fair Housing Survey How familiar are you with fair housing laws? State of North Dakota Fair Housing Survey Response Not Familiar Somewhat Familiar Very Familiar Missing Total Total 16 21 12 16 65
Fair Housing Survey Fair Housing Barriers State of North Dakota Fair Housing Survey Too Much Amount The Right Too Little Don t Know Question Missing Total Please assess the level of fair housing outreach and education activity in the State. Please assess the current level of fair housing testing in the State. 0 10 21 17 17 65 1 6 16 . 17 65
Findings: Contributing Factors State of North Dakota Contributing Factors Priority Justification In 2017, black, American Indian, Native Hawaiian, and other race, households had a moderate to high level of segregation, according to the Dissimilarity Index. Moderate to high levels of segregation High Low poverty index is markedly lower for Native American populations than white households, indicating inequitable access to low poverty areas. Access to low poverty areas and concentrations of poverty High Native American households have less access to labor market engagement as indicated by the Access to Opportunity index. However, the State has little control over impacting labor market engagement on a large scale. Access to labor market engagement Med
Findings: Contributing Factors State of North Dakota Contributing Factors Priority Justification Native American households have lower levels of access to proficient schools. Access to School Proficiency Med Some 19.6 percent of households have cost burdens. This is more significant for renter households, of which 35.7 percent have cost burdens. In addition, 70.9 percent of households below 30 percent HAMFI have cost burdens. This signifies a lack of housing options that are affordable to a large proportion of the population. Insufficient affordable housing in a range of unit sizes High Black, American Indian, and Hispanic households face a disproportionate rate of housing problems at rates of 50.7 percent, 35.0 percent, and 40.6 percent, respectively. This is compared to the State average of 22.0 percent. Black, American Indian, and Hispanic households have disproportionate rates of housing problems High
Findings: Contributing Factors State of North Dakota Contributing Factors Priority Justification The mortgage denial rates for black, Native American, and Hispanic households are higher than the jurisdiction average according to 2008- 2018 HMDA data. The number of accessible affordable units may not meet the need of the growing elderly and disabled population, particularly as the population continues to age. Some 46.7 percent of persons aged 75 and older have at least one form of disability. Discriminatory patterns in Lending Med Insufficient accessible affordable housing High Fair housing complaint data and fair housing testing results found disability to be the number one basis for discrimination in the State. Discrimination on the basis of disability High
Findings: Contributing Factors State of North Dakota Contributing Factors Priority Justification The fair housing survey and public input indicated a lack of collaboration among agencies to support fair housing. Lack of fair housing infrastructure High The fair housing survey and public input indicated a lack of knowledge about fair housing and a need for education. Insufficient fair housing education High The fair housing survey and public input indicated an insufficient understanding of credit needed to access mortgages. Insufficient understanding of credit High
Fair Housing Goals: Impediments to Fair Housing Choice/ Contributing Factors Fair Housing Goal Fair Housing Issue Recommended Actions Continue to promote homeownership and affordable rental opportunities in high opportunity areas with the use of CDBG, HOME, and HTF funds. Over the next five (5) years: Moderate to high levels of segregation Access to low poverty areas Promote affordable housing development in high opportunity areas Insufficient affordable housing in a range of unit sizes Segregation 150 rental units added 500 rental units rehabilitated 150 homeowner housing units rehabilitated 100 households down payment and closing cost assistance for first-time homebuyers R/ECAPs Disproportionate Housing Need Black, American Indian, and Hispanic households have disproportionate rates of housing problems Discriminatory patterns in Lending Track activities annually in the State s PER.
Fair Housing Goals: Impediments to Fair Housing Choice/ Contributing Factors Fair Housing Goal Fair Housing Issue Recommended Actions Continue to partner with the HPFHC to conduct tests on selected newly constructed housing units and apartment complexes. Record activities annually in the State s PER. Insufficient accessible affordable housing Continue to partner with the HPFHC, DOLHR, and other non-profit organizations, and local ADA coordinators to conduct outreach and education to professionals in the housing construction industry on the subject of accessibility and reasonable accommodation. Record activities annually in the State s PER. Promote community and service provider knowledge of ADA laws Disability and Access Discrimination on the basis of disability
Fair Housing Goals: Impediments to Fair Housing Choice/ Contributing Factors Fair Housing Goal Fair Housing Issue Recommended Actions Access to low poverty areas Encourage increased public services and public investment in high poverty areas in the State. Record activities annually in the State s PER. Enhance community services in R/ECAPs Disparities in Access to Opportunity Access to job proximity Access to school proficiency
Fair Housing Goals: Impediments to Fair Housing Choice/ Contributing Factors Fair Housing Goal Fair Housing Issue Recommended Actions Continue to partner with the High Plains Fair Housing Center (HPFHC), North Dakota Department of Labor and Human Rights (DOLHR), and other non- profit organizations to conduct outreach and education to professionals in the housing industry. Record activities annually in the State s PER. Moderate to high levels of segregation Enhance outreach and education to units of local government, as well as housing consumers, as it relates to affirmatively furthering fair housing and the duty to affirmatively further fair housing. Record activities annually in the State s PER. Increase fair housing outreach and education in the State Access to low poverty areas and concentrations of poverty Fair Housing Enforcement and Outreach Discriminatory patterns in Lending Conduct outreach and education of prospective housing consumers, enhance credit counseling and education to prospective home buyers, focusing on strategies to build credit for home purchases, in partnership with local lenders and civic institutions. Record activities annually in the State s PER.
AI Contact: Bonnie Malo Director Division of Community Services 701.328.2476 bmalo@nd.gov