Resource Analysis Summary Report for Instructional Costs
This Resource Analysis Summary Report analyzes instructional costs for different campuses based on subject code and course level. It outlines how model costs used in the State Share of Instruction (SSI) are calculated by dividing the sum of unrestricted costs by Full-Time Equivalents (FTE). The report covers the assignment of Subsidy Model Codes, finalized data on FTE costs, and comparisons of model costs across institutions. Additionally, it discusses the calculation of SSI model costs for the FY 2024-2025 biennium based on FY 2019 data.

Download Presentation

Please find below an Image/Link to download the presentation.
The content on the website is provided AS IS for your information and personal use only. It may not be sold, licensed, or shared on other websites without obtaining consent from the author. Download presentation by click this link. If you encounter any issues during the download, it is possible that the publisher has removed the file from their server.
E N D
Presentation Transcript
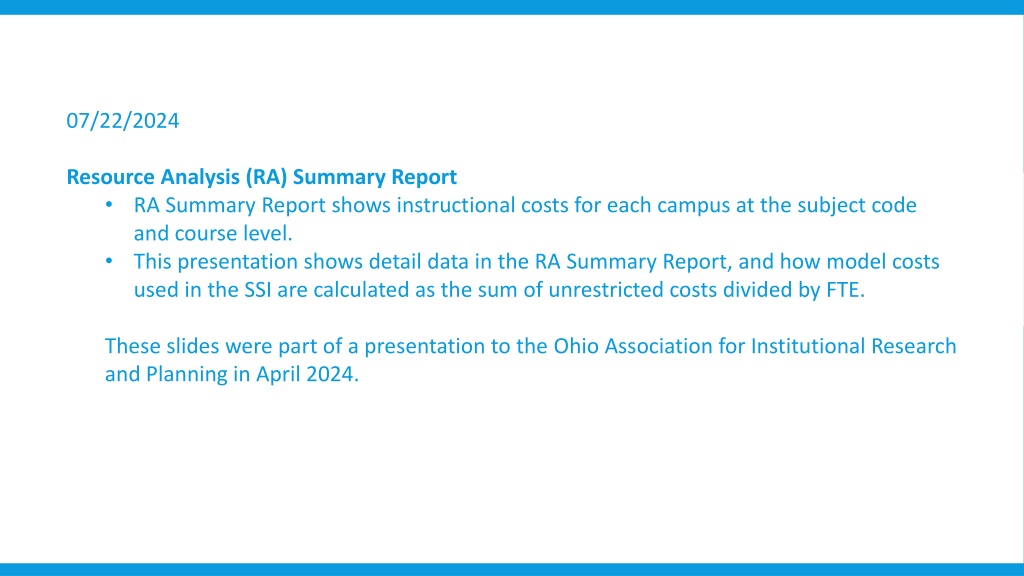
07/22/2024 Resource Analysis (RA) Summary Report RA Summary Report shows instructional costs for each campus at the subject code and course level. This presentation shows detail data in the RA Summary Report, and how model costs used in the SSI are calculated as the sum of unrestricted costs divided by FTE. These slides were part of a presentation to the Ohio Association for Institutional Research and Planning in April 2024.
HEI Portal > sign in > Reports > Resource Analysis Reports > Resource Analysis Summary Resource Analysis Summary https://hei.ohiohighered.org
Resource Analysis Summary Report using finalized data FTEs costs
Subsidy Model Codes The Subject Code and Course Level for each course are used in combination to assign a Subsidy Model Code based on cost and content. Each course is assigned to one of 26 cost models: AH, Arts & Humanities (1-6) BES, Business, Education and Social Sciences (1-7) STEM, Science, Technology, Engineering, Math (1-9) Doctoral (1-2) Medical (1-2)
Finalized data in the Resource Analysis Summary report is available for all institutions. FY 2021: Example of Model Costs using all institutions. Model Costs = sum of all unrestricted costs divided by sum of all student FTEs. Unrestricted Costs in the Resource Analysis Summary Report. Compensation Funding Unit Overhead Medical Funding Unit Cost Student Service Institutional Support Academic Support Unallocated Funding Unit Overhead Library POM
Finalized data in the Resource Analysis Summary report is available for all institutions. FY 2021: Comparison of Model Costs using all institutions and Model Costs (table on left) from one Community College (table on right). Model Costs = sum of all unrestricted costs divided by sum of all student FTEs. Unrestricted Costs in the Resource Analysis Summary Report. Compensation Funding Unit Overhead Medical Funding Unit Cost Student Service Institutional Support Academic Support Unallocated Funding Unit Overhead Library POM
State Share of Instruction (SSI) Model Costs for FY 2024 FY 2025 Biennium were calculated using Resource Analysis data FY 2019 Total Unrestricted Costs inflated to FY 2021 dollars FY 2019 Total Unrestricted Costs HECA Inflation Rate Three fiscal years of data FY 2024 SSI Model Costs HECA Inflation Rate, average of most recent published three years. Apply this average annual rate to project Model Costs into years in the biennium. Sum costs and divide by Total FTE to produce: FY 2020 Total Unrestricted Costs inflated to FY 2021 dollars FY 2020 Total Unrestricted Costs HECA Inflation Rate FY 2025 SSI Model Costs average cost per FTE in FY 2021 dollars FY 2021 Total Unrestricted Costs (no inflation needed) FY 2021 Total Unrestricted Costs Example next slide HECA = Higher Education Cost Adjustment from State Higher Education Executive Officers Association. State Higher Education Finance.
Example of projection of model costs into the FY 2024 FY 2025 biennium, using model AH 1 values as an example Three fiscal years of data HECA Inflation Rate, average of most recent published three years. Apply this average annual rate to project Model Costs into years in the biennium. FY 2024 SSI Model Costs FY 2025 SSI Model Costs Sum costs and divide by Total FTE to produce: average cost per FTE in FY 2021 dollars HECA = Higher Education Cost Adjustment from State Higher Education Executive Officers Association. State Higher Education Finance.


 Model Costs for FY 2024 –")