Nutrition Surveillance in Kenya: Workshop Insights and Challenges
The ongoing activities of the Nutrition Surveillance Learning Network in Kenya, presented by Samuel Murage, shed light on malnutrition statistics, micronutrient deficiencies, breastfeeding trends, vitamin A supplementation, and IFAs for pregnant women. The presentation also discussed information systems and datasets available for monitoring and evaluation in the country, highlighting gaps and challenges in nutrition surveillance.
Download Presentation

Please find below an Image/Link to download the presentation.
The content on the website is provided AS IS for your information and personal use only. It may not be sold, licensed, or shared on other websites without obtaining consent from the author. Download presentation by click this link. If you encounter any issues during the download, it is possible that the publisher has removed the file from their server.
E N D
Presentation Transcript
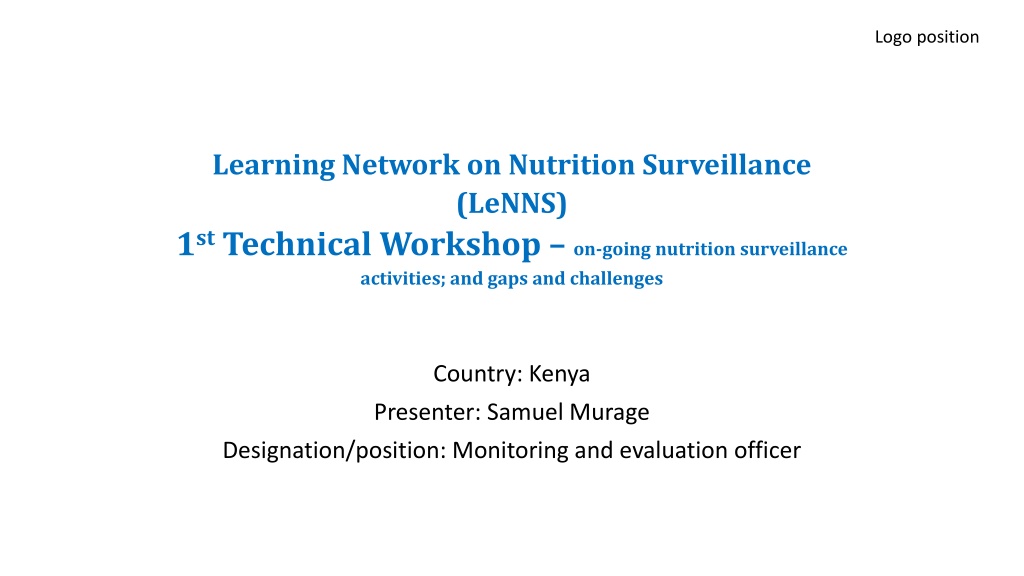
Logo position Learning Network on Nutrition Surveillance (LeNNS) 1stTechnical Workshop on-going nutrition surveillance activities; and gaps and challenges Country: Kenya Presenter: Samuel Murage Designation/position: Monitoring and evaluation officer
Nutrition situation 1/5 Percentage of children under-five who are malnourished 80 Stunted Wasted Overweight Overweight and or obesity, among women was 23.9% 70 60 50 40 38 36 35 40 26 30 20 7 7 7 6 4 10 0 6 6 6 5 4 1993 DHS 1998 DHS 2003 DHS 2008-09 DHS 2014 DHS
Prevalence of micronutrient deficiencies 2/5 Iron Deficiency Anaemia Vitamin B12 Deficiency Iron Deficiency ZINC Deficiency VAD Marginal Folate Deficiency Iodine Deficiency Anaemia VAD Men 9.3 3.6 2.9 74.8 Men 0 0 Pre School 26.3 21.8 13.3 83.3 Pre School 52.6 9.2 School Age children 16.5 9.4 4.9 80.2 School Age children 33.9 4.7 22.1 Preg.Wome n 41.6 36.1 26 68.3 Preg.Wom en 21.6 5.4 7.7 32.1 Non Pregnant Women Non Pregnant Women 21.9 21.3 14 82.3 8.1 2 34.7 30.9 25.6 Data source: KNMS 2011
Breastfeeding trends 3/5 % of children 0-5 months who are exclusively breastfed 100 90 80 70 61 60 50 40 32 23 30 17 13 13 20 10 0 1989 DHS 1993 DHS 1998 DHS 2003 DHS 2008-09 DHS 2014 DHS 2022 DHS
Vitamin A supplementation 4/5 National annual VAS Coverage among children aged 6-59months 100 80 Percentage 60 40 20 0 2010 2011 2012 2013 2014 2015 2016 2017 2018 2019 2020 2021 Year Data source: KHIS
Pregnant Women attending ANC issued with IFAs Combined 5/5 IFAs Combined 100.0 80.0 Percentage 60.0 40.0 20.0 0.0 2013 10.9 2014 22.9 2015 34.1 2016 42.2 2017 50.1 Year 2018 71.2 2019 77.5 2020 74.9 2021 79.1 IFAs Combined Data source: KHIS
Description of the Main Information Systems and Datasets Available 1/2 Main Information Systems Data Sets /indicators Available Integrated Management of Acute Malnutrition (IMAM) Monthly KHIS Aggregate(DHIS)2- Routine data Cure rate, Defaulter rate, Non Response rate, Death Rate, A visualization tool for 8 indicators captured under KHIS and KNAP Kenya Nutrition Score card
Description of the Main Information Systems and Datasets Available 2/2 Main Information Systems Data Sets Available Nutrition Information Systems SMART Surveys, KABP-MIYCN, Capacity Assessments Small scale surveys & rapid Assessments, Program coverage surveys, IPC AMN & Food security, KNMS KeNADA DHS 2014,2008,etc KIHBS Census IMAM, Food Fortification (MoH) Information Platform Nutrition website Sentinel surveillance (NDMA) MUAC
Indicators in the DHS data sets 11. Minimum acceptable diet 6 23 months (MAD) Ever breastfed (EvBF) 1. Early initiation of breastfeeding (EIBF) 2. 12. Egg and/or flesh food consumption 6 23 months (EFF) Exclusively breastfed for the first two days after birth (EBF2D) 3. 13. Sweet beverage consumption 6 23 months (SwB) Exclusive breastfeeding under six months (EBF) 4. Mixed milk feeding under six months (MixMF ) 5. 14. Unhealthy food consumption 6 23 months (UFC) Continued breastfeeding 12 23 months (CBF) 6. Introduction of solid, semi-solid or soft foods 6 8 months (ISSSF) 7. 15. Zero vegetable or fruit consumption 6 23 months (ZVF) Minimum dietary diversity 6 23 months (MDD) 8. 16. Bottle feeding 0 23 months (BoF) Minimum meal frequency 6 23 months (MMF) 9. 10. Minimum milk feeding frequency for non- breastfed children 6 23 months (MMFF) 17. Anthropometric Assessment(U5,Men, Women)
Currently on-going nutrition surveillance efforts 1/2 Sentinel MUAC- National Drought Management Authority(NDMA) D/KHIS 2 Routine health facility information ( Integrated Management of Acute Malnutrition( IMAM) &Nutrition indicators ( CHANIS, Maternal nutrition indicators Micronutrient indicators ( VAS,IFAs), NCD, data collection MoH Monitoring the utilisation/uptake of essential health services in the ASAL counties of Kenya, in the context of the current drought SMART surveys in counties inclusion of WASH . MOH,line ministries. and partners Used during the seasonal assessments( LRA&SRA ) to describe the situation and inform interventions spearheaded by NDMA
Currently on-going nutrition surveillance efforts 2/2 Coverage surveys ( SQUEAC ) MOH and partners Large surveys with Nutrition indicators e.g KDHS, KNMCS KNBS and MOH Coordinated by MOH through the technical working groups School feeding Programmes (MoH, MoE , WFP) National Information Platform for Food Security and Nutrition(NIPFN) Converge of all data from various Ministries led by KNBS
Examples of how surveillance data has been used for policy/strategies/programs in the past 5 years Through KNAP, the government focus is Increased coverage of integrated management of acute malnutrition (IMAM) services scaling up in the entire country Policy change in the delivery mechanism of Vitamin A supplementation( CHU, ECDs, outreaches and static Health facilities). IFAs supplementation ( issuance and consumption of the same)
Challenges and gaps in nutrition surveillance Lack of funding to conduct surveys/assessments at sub national levels especially for non ASAL areas Quality issues with routine data thus cannot be entirely relied upon for nutrition situation analysis Capacity gaps in data analysis and utilization across all levels of the health system
Innovative approaches in nutrition surveillance 1/2 Family MUAC Empowering community screening through mother led MUAC for early detection and referral- where communities/caregivers are empowered to detect and refer malnourished in their households IMAM surge approach Build resilience of health facilities to cope with increased malnutrition caseload and ensure timely detection of deteriorating situation and timely response Logistics Management Information System (LMIS) Utilized in tracking of ordering and distribution of nutrition commodities through training of health facilities on quantification, forecasting and consumption and reporting on nutrition commodities ONE reporting system Standardization of data collection tools and indicator definitions. National Information Platform for Food and Nutrition(NIPFN) Kenya National Data Archives (KeNADA) Introduction of one central repository for all nutrition and food security related data hosted by KNBS Visualization of data using SCORE CARD
Innovative approaches in nutrition surveillance 2/2 Use of technology for data collection in surveys has greatly improved data quality through daily plausibility checks Government leadership in all assessments and coordination has ensured streamlining improvement and sustainability Regular data clinics to address Nutrition information issues (bi annual) Use of multi faceted approach in service delivery and data collection ( Community Health Units, ECDs centres Capacity strengthening at National and subnational level to conduct nutrition surveys
Future country plans in nutrition surveillance Digitalizing of Routine health (Nutrition) information. More effort on utilization of nutrition information by all stakeholders (data producers and consumers ) and Capacity building . Consolidating the gains made . Timely dissemination of Quality Nutrition information products (infographics). Resource mobilization to enable counties conduct mid-term Nutrition assessments
