Understanding the Minimum Wage Increase: By the Numbers
Exploring the impact of the minimum wage increase on employees and employers, this detailed analysis breaks down the employee and employer portions, total wages, benefits, and budget implications. It also outlines the progression towards a $15 per hour minimum wage by 2025 as per the Lifting Up American Working Families Act.
Download Presentation

Please find below an Image/Link to download the presentation.
The content on the website is provided AS IS for your information and personal use only. It may not be sold, licensed, or shared on other websites without obtaining consent from the author. Download presentation by click this link. If you encounter any issues during the download, it is possible that the publisher has removed the file from their server.
E N D
Presentation Transcript
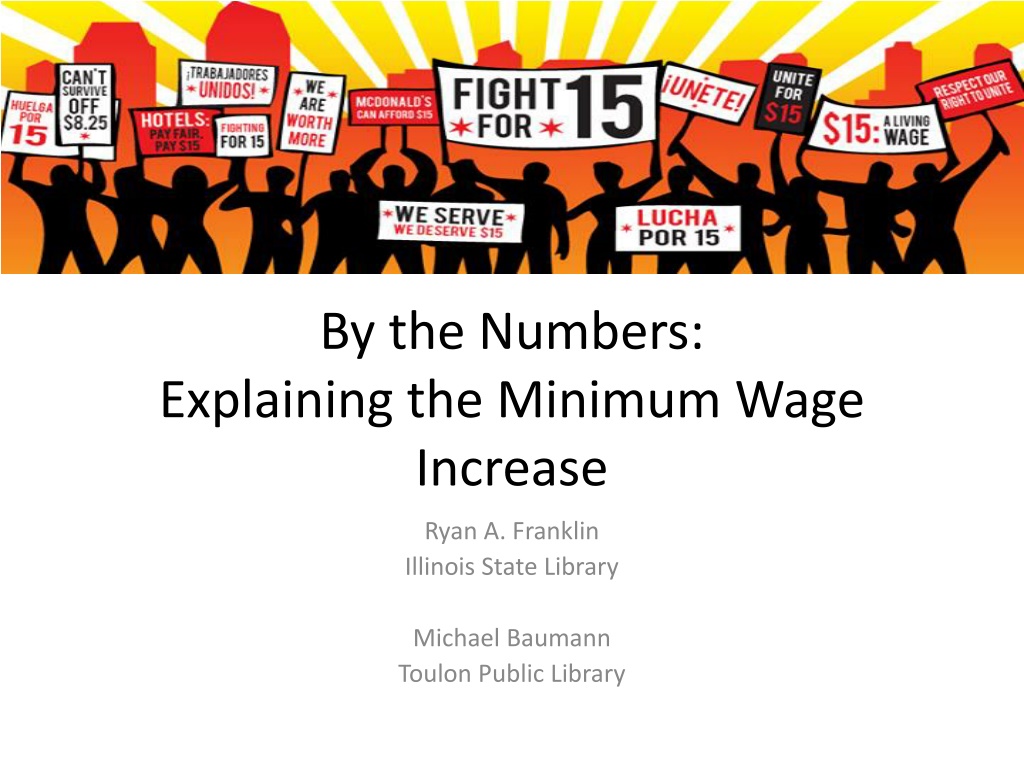
By the Numbers: Explaining the Minimum Wage Increase Ryan A. Franklin Illinois State Library Michael Baumann Toulon Public Library
Employee Portion Wage per hour or Salary Employee Benefits and Requirements Federal Tax State Tax FDIC Medical Retirement Union etc Gross Pay Benefits/ Requirements Various Take home after benefits are deducted from the gross amount Net Pay
Employer Portion Wage per hour or Salary Gross Pay Required FDIC 7.65 % Currently Federal Unemployment 6% State Unemployment 3.175%* Employer Portion Retirement Health Vacation and Sick Days Other Benefits Employer Portion Payroll per person Total of everything above * State unemployment rate various by business type, how long in business, number of employees, etc.
Current Employee Example Employee Work Schedule Employee Title Part Time Minimum Wage $8.25 Hours Worked per week 20 Weeks in the year 52 Total Wage (gross) $8,580.00 Employer Portions FICA Rate: 7.65% $656.37 Fed. Unemployment: 6% $514.80 State unemployment 3.175% $1.65 Total Employer Portion $1,172.82 Total funds from Library budget $9,752.82 Other Added Benefits Retirement (varies) (EX 10%) $0.00 Health (Varies, Normally flat fee for single another for family) (EX $300 S, $1000Family) $0 Total Funds From LB 2 $9,752.82
Current Staff Example Employee Work Schedule Employee Title Minimum Wage Hours Worked per week Weeks in the year Total Wage (gross) Part Time $8.25 Full Time $8.25 Longevity/Level Director $20.00 $11.00 20 52 40 52 40 52 40 52 $8,580.00 $17,160.00 $22,880.00 $41,600.00 Employer Portions FICA Rate: 7.65% Fed. Unemployment: 6% State unemployment 3.175% Total Employer Portion $656.37 $514.80 $1.65 $1,172.82 $1,312.74 $1,029.60 $1.65 $2,343.99 $1,750.32 $1,372.80 $1.65 $3,124.77 $3,182.40 $2,496.00 $1.65 $5,680.05 Total funds from Library budget $9,752.82 $19,503.99 $26,004.77 $47,280.05 Other Added Benefits Retirement (varies) (EX 10%) Health (Varies, Normally flat fee for single another for family) (EX $300 S, $1000Family a month) $0.00 $1,716.00 $2,288.00 $4,160.00 $0 $12,000 $12,000 $12,000 Total Funds From LB 2 $9,752.82 $33,219.99 $40,292.77 $63,440.05
$15 per hour by 2025 Lifting Up American Working Families Act Signed by Governor Pritzker 2.19.19 SB-0001 PA 101-0001 Date Rate % ^ January 1, 2020 $9.25 12% July 1, 2020 $10 7.50% January 1, 2021 $11 9.09% January 1, 2022 $12 8.33% January 1, 2023 $13 7.69% January 1, 2024 $14 7.14% January 1, 2025 $15 6.66%
Minimum Wage Outlook Employee Work Schedule Employee Pay: Part Time Current 2020 pt 1 2020 pt 2 2021 2022 2023 2024 2025 Minimum Wage $8.25 $9.25 $10.00 $11.00 $12.00 $13.00 $14.00 $15.00 Hours Worked per week 20 20 20 20 20 20 20 20 Weeks in the year 52 52 52 52 52 52 52 52 Total Wage (gross) $8,580.00 $9,620.00 $10,400.00 $11,440.00 $12,480.00 $13,520.00 $14,560.00 $15,600.00 Employer Portions FICA Rate: 7.65% $656.37 $735.93 $795.60 $875.16 $954.72 $1,034.28 $1,113.84 $1,193.40 Fed. Unemployment: 6% $514.80 $577.20 $624.00 $686.40 $748.80 $811.20 $873.60 $936.00 State unemployment 3.175% $1.65 $1.65 $1.65 $1.65 $1.65 $1.65 $1.65 $1.65 Total Employer Portion $1,172.82 $1,314.78 $1,421.25 $1,563.21 $1,705.17 $1,847.13 $1,989.09 $2,131.05 Total funds from Library budget $9,752.82 $10,934.78 $11,821.25 $13,003.21 $14,185.17 $15,367.13 $16,549.09 $17,731.05 Additional funds needed 0 $1181.96 $887.00 $1181.96 $1181.96 $1181.96 $1181.96 $1181.96 $7978.76 Increase in staffing budget
Increase Across Staff Employee Work Schedule Employee Pay: Part Time Minimum Wage Total Funds From LB 2 Current $8.25 $9,752.82 $10,934.78 $11,821.25 $13,003.21 $14,185.17 $15,367.13 $16,549.09 $17,731.05 2020 pt 1 $9.25 2020 pt 2 $10.00 2021 $11.00 2022 $12.00 2023 $13.00 2024 $14.00 2025 $15.00 $7,978.23 Employee Pay: Full Time Minimum Wage Total Funds From LB 2 Current $8.25 $33,219.99 $35,791.91 $37,720.85 $40,292.77 $42,864.69 $45,436.61 $48,008.53 $50,580.45 $17,360.46 2020 pt 1 $9.25 2020 pt 2 $10.00 2021 $11.00 2022 $12.00 2023 $13.00 2024 $14.00 2025 $15.00 Employee Pay: Longevity/Level Wage Current $11.00 2020 pt 1 $11.00 2020 pt 2 $11.00 2021 $11.00 2022 $12.00 2023 $13.00 2024 $14.00 2025 $15.00 Total Funds From LB 2 $40,292.77 $40,292.77 $40,292.77 $40,292.77 $42,864.69 $45,436.61 $48,008.53 $50,580.45 $10,287.68 Employee Pay: Director Wage Total Funds From LB 2 Current $20.00 $63,440.05 $63,440.05 $63,440.05 $63,440.05 $63,440.05 $63,440.05 $63,440.05 $63,440.05 2020 pt 1 $20.00 2020 pt 2 $20.00 2021 $20.00 2022 $20.00 2023 $20.00 2024 $20.00 2025 $20.00 $0.00 $3,753.88 $2,815.41 $3,753.88 $6,325.80 $6,325.80 $6,325.80 $6,325.80 $35,626.37 $35,626.37 Increase in staffing over 6 years *Assumes retirement and medical benefits stay constant
Equal Wage Increase Across Staff Employee Pay: Part Time Minimum Wage Total Funds From LB 2 Current $8.25 $9,752.82 $10,934.78 $11,821.25 $13,003.21 $14,185.17 $15,367.13 $16,549.09 $17,731.05 2020 pt 1 $9.25 2020 pt 2 $10.00 2021 $11.00 2022 $12.00 2023 $13.00 2024 $14.00 2025 $15.00 $7,978.23 Employee Pay: Full Time Minimum Wage Total Funds From LB 2 Current $8.25 $33,219.99 $35,791.91 $37,720.85 $40,292.77 $42,864.69 $45,436.61 $48,008.53 $50,580.45 $17,360.46 2020 pt 1 $9.25 2020 pt 2 $10.00 2021 $11.00 2022 $12.00 2023 $13.00 2024 $14.00 2025 $15.00 Employee Pay: Longevity Wage Total Funds From LB 2 Current $11.00 $40,292.77 $42,864.69 $44,793.63 $47,365.55 $49,937.47 $52,509.39 $55,081.31 $57,653.23 $17,360.46 2020 pt 1 $12.00 2020 pt 2 $12.75 2021 $13.75 2022 $14.75 2023 $15.75 2024 $16.75 2025 $17.75 Employee Pay: Director Wage Total Funds From LB 2 Current $20.00 $63,440.05 $65,368.99 $67,940.91 $70,512.83 $73,084.75 $75,656.67 $78,228.59 $80,800.51 $17,360.46 2020 pt 1 $20.75 2020 pt 2 $21.75 2021 $22.75 2022 $23.75 2023 $24.75 2024 $25.75 2025 $26.75 $7072.78 $6429.8 $7715.76 $7715.76 $7715.76 $7715.76 $7715.76 $52,081.38 $52,081.38 Increase in staffing over 6 years *Assumes retirement and medical benefits stay constant
Equal % Increase Across Staff Employee Pay: Part Time Minimum Wage Total Funds From LB 2 Current 2020 pt 1 2020 pt 2 2021 $11.00 2022 $12.00 2023 $13.00 2024 $14.00 2025 $15.00 $8.25 $9.25 $10.00 $9,752.82 $10,934.78 $11,821.25 $13,003.21 $14,185.17 $15,367.13 $16,549.09 $17,731.05 $7,978.23 Employee Pay: Full Time Minimum Wage Total Funds From LB 2 Current 2020 pt 1 2020 pt 2 2021 $11.00 2022 $12.00 2023 $13.00 2024 $14.00 2025 $15.00 $8.25 $9.25 $10.00 $33,219.99 $35,791.91 $37,720.85 $40,292.77 $42,864.69 $45,436.61 $48,008.53 $50,580.45 $17,360.46 2020 pt 1 (12%) 2020 pt 2 (7.5%) 2021 (9.09%) 2022 (8.33%) 2023 (7.69%) Employee Pay: Longevity Wage Total Funds From LB 2 Current 2024 (7.14%)2025 (6.66%) $18.06 $58,446.48 $11.00 $12.32 $13.24 $14.45 $15.65 $16.85 $19.26 $40,292.77 $43,687.71 $46,064.16 $49,160.44 $52,255.77 $55,351.31 $61,539.70 $21,246.93 2020 pt 1 (12%) 2020 pt 2 (7.5%) 2021 (9.09%) 2022 (8.33%) 2023 (7.69%) Employee Pay: Director Wage Total Funds From LB 2 Current 2024 (7.14%)2025 (6.66%) $32.83 $96,446.79 $102,070.83 $20.00 $22.40 $24.08 $26.27 $28.46 $30.65 $35.02 $63,440.05 $69,612.66 $73,933.48 $79,563.09 $85,190.96 $90,819.21 $38,630.78 $12,139.46 $8,626.22 $11,297.81 $11,295.11 $11,295.72 $11,294.66 $11,289.19 $77,238.17 $77,238.17 Increase in staffing over 6 years *Assumes retirement and medical benefits stay constant
Standard Library Budget Breakdowns 70% Staffing 45% Salary 25% Benefits 12% Collection 18% Everything Else Example $100,000 $70,000 Staff $12,000 Collection $18,000 Everything Else Example $500,000 $350,000 Staff $60,000 Collection $90,000 Everything Else *% from Standards for Illinois Libraries 3.0
Standard Library Budget Increase 0-5% per year Minimum Wage Increase 6-12% per year
Barriers in increasing the Library Budget PTELL/Tax Caps Referenda Elections Public Outcry
How to Afford the increase Payoff longstanding debt Building maintenance New Structures Put off big projects New structures Department updating Realign budget percentages Put of long term maintenance Lower collection budget Decrease in programs or program spending Realign workflow Decrease staff and/or staff hours Remove/lower benefits Add more self service Decrease service desks Adjust Hours Longer hours in winter, shorter in summer (or vice versa) Permanent change in hours to shorter days, or fewer days open (pushes against current standards or various rules) Other Climatic changes in building Decrease services Increase or introduce fess for certain services MASSIVE FUNDRAISING
