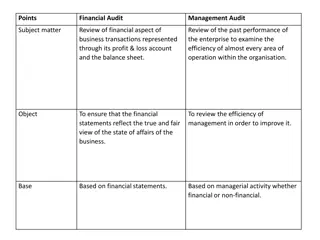
Distance-Based Suspicion Score for Audit Selection

Nuriddin Tojiboyev presented a method for audit selection based on distance measures, risk filtering, and exception sorting. The approach involves selecting representative samples from a population of records, using risk-based filtering to prioritize records for review. Various filters and exceptions are considered, such as unauthorized salary increases and duplicate payments. The process includes visualization of risk compositions and selection strategies like Skipper and Stretcher. By setting similarity thresholds and prioritizing exceptions based on suspicion scores, the method aims to enhance audit efficiency and accuracy.

Uploaded on Sep 12, 2024 | 0 Views
Download Presentation

Please find below an Image/Link to download the presentation.
The content on the website is provided AS IS for your information and personal use only. It may not be sold, licensed, or shared on other websites without obtaining consent from the author. Download presentation by click this link. If you encounter any issues during the download, it is possible that the publisher has removed the file from their server.
E N D
Presentation Transcript
Distance-Based Suspicion Score for Audit Selection presented by Nuriddin Tojiboyev
Audit Selection Sample representative of population Records to Review Population of Records Selection risk-based filtering 2
Records, Filters and Exceptions 10 8 Transaction Records Examples of Risk for Filters Unauthorized salary increases 6 Inflated overtime hours Filters/Rules Payments to Terminated employees 4 Duplicate Payments 2 Unauthorized travel/vacation payments Exceptions 0 3
Distance Measures Euclidian Mahalanobis 5
Visualization of Risk Composition Overtime Filter Salary Increase Filter 8
Skipper and Stretcher 9
Visualization of Skipper Approach Overtime Filter Salary Increase Filter 10
Skipper Selection Strategy 1) Set a maximum similarity threshold for the selection set 2) Select one exception at a time, running down the exception list sorted by suspicion score 3) Select the exception to the selection if no similar exception already exists in the selection set # TranID Filter 1 Filter 2 Filter 3 Filter 4 Filter 5 Filter 6 Filter 7 Distance 27.69 0.00 0.00 0.00 174.38 87.69 0.00 0.00 0.00 0.00 36.26 0.00 0.00 60.00 0.00 0.00 0.00 60.00 0.00 0.00 0.00 9.71 0.00 0.00 0.00 36.92 0.00 0.00 0.00 36.92 0.00 0.00 0.00 0.00 0.00 0.00 0.00 0.00 0.00 0.00 12.77 0.00 0.00 0.00 0.00 0.00 0.00 0.00 0.00 0.00 12.50 0.00 0.00 27.69 0.00 0.00 0.00 0.00 0.00 0.00 10.00 0.00 0.00 0.00 9.54 1 2 3 4 5 6 7 8 9 15 0.00 1.00 1.00 1.00 1.00 0.00 0.00 2.00 2.00 3.00 0.00 0.00 1.00 1.00 2.00 1.00 0.00 0.00 0.00 0.00 0.00 0.00 0.00 0.00 0.00 0.00 0.00 0.00 0.00 0.00 0.00 0.00 19.90 11.06 8.50 7.80 7.70 6.69 4.79 4.73 3.94 3.38 3.34 3.08 2.93 2.92 2.65 2.52 11662 449 6627 10967 53.97 0.00 40.48 39.00 58.58 24.87 23.73 34.81 0.00 29.55 27.31 0.00 0.00 0.00 0.00 68 4754 3900 3901 10042 4942 7843 437 11193 9632 14020 10 11 12 13 14 15 16 11
Exception Selection Procedure a) b) For each candidate, calculate similarity to each of the already selected items Include the candidate to the selection if maximum of similarity scores of the candidate to the already selected items is less or equal to threshold Terminate when sample size is reached, or exception list is fully covered c) Population Sorted By Risk Score Selection # TranID Filter 1 Filter 2 Filter 3 Filter 4 Filter 5 Filter 6 Filter 7 Distance 27.69 0.00 0.00 0.00 174.38 87.69 0.00 0.00 0.00 0.00 36.26 0.00 0.00 60.00 0.00 0.00 0.00 60.00 0.00 0.00 0.00 9.71 0.00 0.00 0.00 36.92 0.00 0.00 0.00 36.92 0.00 0.00 0.00 0.00 0.00 0.00 0.00 0.00 0.00 0.00 12.77 0.00 0.00 0.00 0.00 0.00 0.00 0.00 0.00 0.00 12.50 0.00 0.00 27.69 0.00 0.00 0.00 0.00 0.00 0.00 10.00 0.00 0.00 0.00 9.54 1 2 3 4 5 6 7 8 9 15 0.00 1.00 1.00 1.00 1.00 0.00 0.00 2.00 2.00 3.00 0.00 0.00 1.00 1.00 2.00 1.00 0.00 0.00 0.00 0.00 0.00 0.00 0.00 0.00 0.00 0.00 0.00 0.00 0.00 0.00 0.00 0.00 19.90 11.06 8.50 7.80 7.70 6.69 4.79 4.73 3.94 3.38 3.34 3.08 2.93 2.92 2.65 2.52 skip 11662 449 6627 10967 53.97 0.00 40.48 39.00 58.58 24.87 23.73 34.81 0.00 29.55 27.31 0.00 0.00 0.00 0.00 skip 68 4754 3900 3901 10042 4942 7843 437 11193 9632 14020 skip 10 11 12 13 14 15 16 skip skip skip skip skip 12
Importance of selecting correct threshold for similarity 1 Higher Similarity a) If similarity threshold is too high, selection budget is exhausted too early and not all of the exceptions will be considered as a candidate b) If similarity threshold is too low, the procedure will skip most exceptions and may not achieve the intended selection size Lower Similarity 0 13
Visualization of Stretcher Approach Overtime Filter Low Risk Salary Increase Filter 14
Stretcher Selection Strategy 1) Identify the set of the exceptions from population that are over certain minimum risk score 2) From the selected set of the riskiest exceptions, select the combination of items that are the most dissimilar to each other for a given set size. N= 50,000 N= 1,000 N= 100 15
Exception Selection Procedure for Stretcher a) b) For all candidates, calculate the similarity matrix Select the most two dissimilar candidates, then select one item a time depending candidate s overall similarity to the already selected items (MaxMin Approach) Terminate when sample size is reached c) Population above certain Risk Score Threshold # TranID Filter 1 Filter 2 Filter 3 Filter 4 Filter 5 Filter 6 Filter 7 Distance 27.69 0.00 0.00 0.00 174.38 87.69 0.00 0.00 0.00 0.00 36.26 0.00 0.00 60.00 0.00 0.00 0.00 60.00 0.00 0.00 0.00 9.71 0.00 0.00 0.00 36.92 0.00 0.00 0.00 36.92 0.00 0.00 0.00 0.00 0.00 0.00 0.00 0.00 0.00 0.00 12.77 0.00 0.00 0.00 0.00 0.00 0.00 0.00 0.00 0.00 12.50 0.00 0.00 27.69 0.00 0.00 0.00 0.00 0.00 0.00 10.00 0.00 0.00 0.00 9.54 Selection 1 2 3 4 5 6 7 8 9 15 0.00 1.00 1.00 1.00 1.00 0.00 0.00 2.00 2.00 3.00 0.00 0.00 1.00 1.00 2.00 1.00 0.00 0.00 0.00 0.00 0.00 0.00 0.00 0.00 0.00 0.00 0.00 0.00 0.00 0.00 0.00 0.00 19.90 11.06 8.50 7.80 7.70 6.69 4.79 4.73 3.94 3.38 3.34 3.08 2.93 2.92 2.65 2.52 11662 449 6627 10967 53.97 0.00 40.48 39.00 58.58 24.87 23.73 34.81 0.00 29.55 27.31 0.00 0.00 0.00 0.00 68 4754 3900 3901 10042 4942 7843 437 11193 9632 14020 10 11 12 13 14 15 16 16
Similarity Measures Angles Distances 17
Few More Points Data Point Values vs Filter Values for Similarity Similarity Measure Choice and Threshold Decision Filter Effectiveness and Adequacy Artifact Evaluation and Validation 18
Thank you!!! Questions?! 19