Why Every Business Needs to Think Like a Data Scientist [BI Tools Explained]
Businesses must adopt a data scientist's mindset to stay competitive. This blog explores how Business Intelligence (BI) tools empower companies to transform raw data into actionable insights, driving strategic decision-making. Discover how advanced f
Download Presentation

Please find below an Image/Link to download the presentation.
The content on the website is provided AS IS for your information and personal use only. It may not be sold, licensed, or shared on other websites without obtaining consent from the author. Download presentation by click this link. If you encounter any issues during the download, it is possible that the publisher has removed the file from their server.
E N D
Presentation Transcript
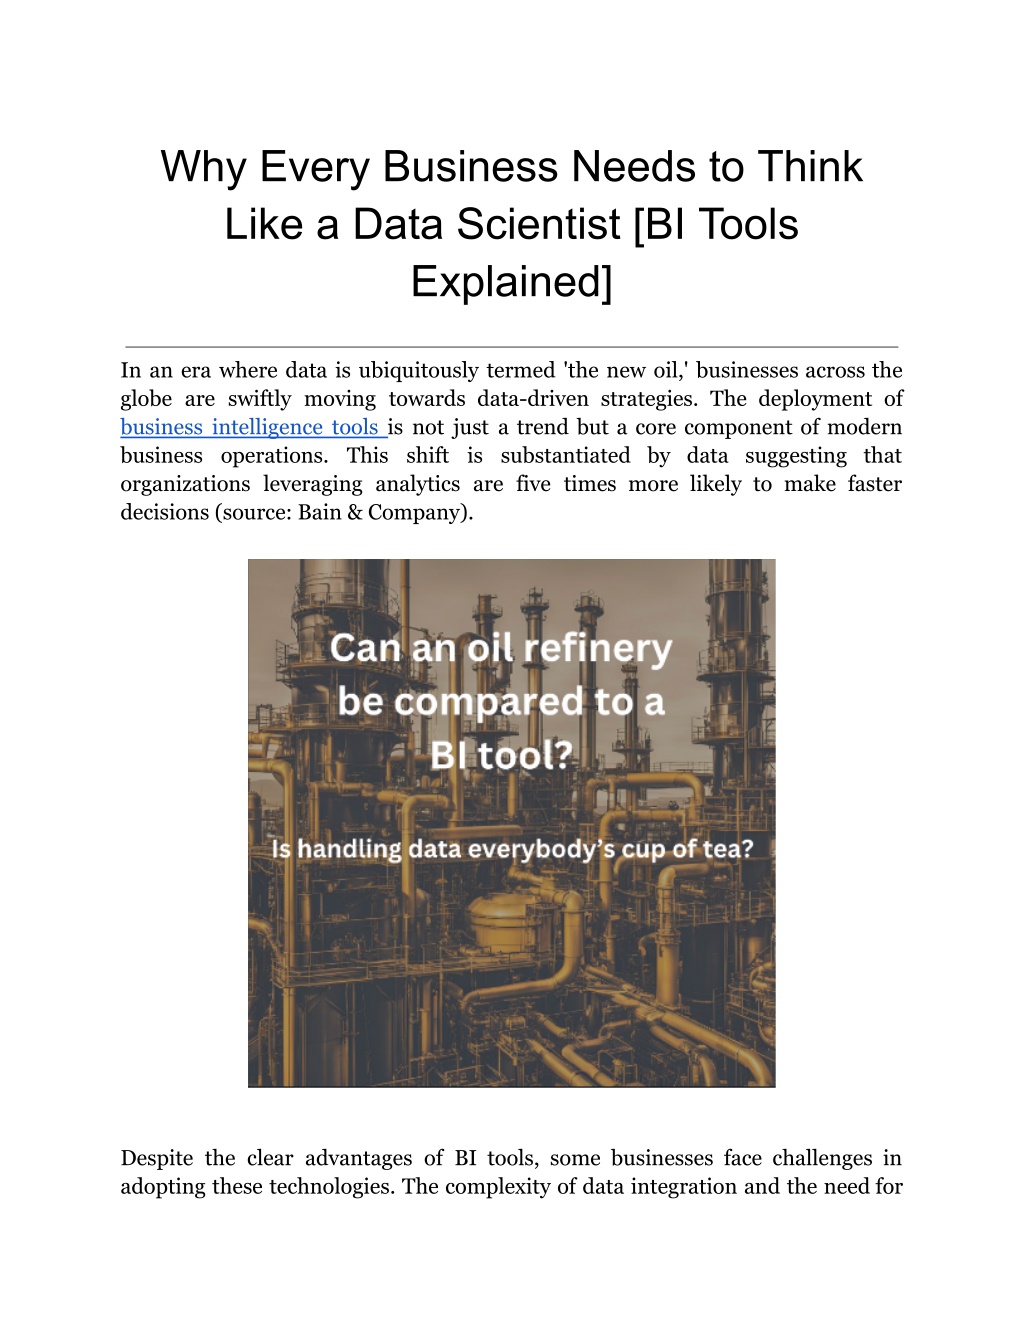
Why Every Business Needs to Think Like a Data Scientist [BI Tools Explained] In an era where data is ubiquitously termed 'the new oil,' businesses across the globe are swiftly moving towards data-driven strategies. The deployment of business intelligence tools is not just a trend but a core component of modern business operations. This shift is substantiated by data suggesting that organizations leveraging analytics are five times more likely to make faster decisions (source: Bain & Company). Despite the clear advantages of BI tools, some businesses face challenges in adopting these technologies. The complexity of data integration and the need for
user-friendly interfaces are significant hurdles. However, the latest advancements in Business Intelligence dashboard software address these issues by offering more intuitive designs and stronger integration capabilities. Let s see how Core Concepts of Data Science Every Business Should Know Data science is the backbone of modern business intelligence (BI), providing the methodologies and tools needed to transform data into actionable insights. Understanding the core concepts of data science is essential for leveraging Business Intelligence tools effectively. This analysis explores these foundational concepts, explaining their relevance and application in everyday business scenarios, enhancing the utility of software for Business Intelligence. 1. Data Mining The process of mining data involves extracting valuable information from large datasets to identify patterns, correlations, and trends. Nothing is more important than this, for businesses to make sense of massive amounts of data. In the context of Business Intelligence dashboard software, data mining can be used to discover sales patterns, customer preferences, and operational inefficiencies. This facilitates more informed decision-making and strategic planning. Common data mining techniques include clustering, classification, regression, and association rules, each serving different analytical needs. 2. Predictive Analytics Predictive analytics usually uses historical data as a basis and statistical models and machine learning algorithms to predict future outcomes. It's about anticipating events before they happen, which is a game-changer for strategic business planning. By integrating predictive analytics into software for Business Intelligence, companies can forecast trends, customer behavior, and market conditions with a high degree of accuracy. Taking this preventative measure allows companies to remain ahead of the competition.
Techniques such as logistic regression, decision trees, and neural networks are commonly used in predictive modeling. Tools embedded in BI software often simplify these complex analyses into user-friendly interfaces. 3. Machine Learning Machine learning (ML) is an AI field that enables systems to learn and improve from experience without being explicitly programmed. It is pivotal for automating analytical model building. ML algorithms enhance Business Intelligence tools by enabling automatic pattern recognition, anomaly detection, and real-time decision-making processes. From customer segmentation to predictive maintenance and fraud detection, ML applications are vast and can significantly boost operational efficiency. 4. Big Data Analytics Big data analytics deals with analyzing extremely large datasets that traditional data processing software cannot handle. Data cleansing, transformation, inspection, and modeling are all part of this cutting-edge process. Business Intelligence dashboard software increasingly incorporates big data capabilities, allowing businesses to handle complex datasets with speed and efficiency. While big data offers profound insights, it also poses challenges like data quality and storage. Effective BI tools help mitigate these issues by providing robust data management and visualization features. 5. Data Visualization Visualization is the presentation of data in a pictorial or graphical format. It allows business users to see analytics presented visually, making the complexities of large data sets much more comprehensible. Dashboard business intelligence excels in transforming complex data outputs into intuitive graphical reports, making it easier for decision-makers to grasp patterns, trends, and outliers.
Practical Operations Applications of Data Science in Business Data science has dramatically transformed how businesses operate by enabling more informed and strategic decision-making. This section delves into how foundational data science concepts such as data mining, predictive analytics, and machine learning are applied in key business areas like customer segmentation, inventory management, and predictive maintenance. These applications are facilitated by advanced Business Intelligence tools, integrating robust software for Business Intelligence, and utilizing efficient dashboard business intelligence systems. 1. Customer Segmentation Data Science Concept: Machine Learning & Data Mining Application: Machine learning algorithms and data mining techniques are extensively used to segment demographics, and purchase history. This segmentation helps businesses tailor marketing strategies, optimize product offerings, and enhance customer service. Impact of BI Tools: Business intelligence tools employ sophisticated clustering algorithms to dynamically segment customers, providing marketers with real-time insights through easy-to-understand dashboards. This direct application of dashboard business intelligence enables businesses to launch targeted campaigns that significantly increase conversion rates and customer satisfaction. customers based on behavior, 2. Inventory Management Data Science Concept: Predictive Analytics Application: Predictive analytics is crucial for efficient inventory management. By analyzing historical sales data, seasonal trends, and supply chain variables, businesses can predict future inventory needs with high accuracy. Role of BI Software: Software for Business Intelligence enhances inventory forecasting by integrating predictive analytics directly into inventory management systems. This allows companies to maintain
optimal stock levels, reduce carrying costs, and avoid stockouts or overstock situations, all visible through an intuitive business intelligence dashboard. 3. Predictive Maintenance Data Science Concept: Machine Learning & Big Data Analytics Application: In industries like manufacturing, transportation, and utilities, predictive maintenance algorithms to analyze data from equipment sensors (part of big data analytics), businesses can predict when a machine is likely to fail or need maintenance. Benefits of BI Tools: The integration of machine learning into Business Intelligence dashboard software allows for continuous monitoring and real-time alerts on equipment status. This application of dashboard business intelligence not only prevents costly downtimes but also extends the lifespan of critical machinery, ensuring operational efficiency. is vital. Using machine learning How BI Tools Empower Businesses to Think Like Data Scientists 1. Simplifying Data Complexity Business intelligence tools simplify the complexity of data analysis by providing advanced data processing capabilities that can handle large volumes of data from diverse sources. Data warehousing involves gathering and managing data from varied sources accumulated into a single, comprehensive database. This centralization is all too necessary because it consolidates diverse data sets from across the organization (including sales, customer interactions, operations, and financials) into a unified format that is easier to analyze. Data warehouses are optimized for read and query operations, speeding up data retrieval upto a thousand notch. This is crucial for analytics and reporting, where quick access to large volumes of data is often needed.
Data warehouses store historical data, enabling businesses to perform trend analyses and longitudinal studies. This aspect helps in understanding changes over time, forecasting future trends, and making informed strategic decisions. Apart from this, BI tools having OLAP allows for the querying and analysis of data in multiple dimensions, making it an essential tool for complex analytical queries. This capability supports viewing data from different perspectives for instance, sales data can be viewed by product, region, time period, or any combination of relevant factors. OLAP systems are designed to deliver quick answers to complex queries. They use multidimensional data structures (cubes), which pre-calculate and store aggregated data, significantly speeding up the data retrieval process. Using data warehouses and OLAP, users can perform sophisticated, ad-hoc analyses without needing extensive statistical or programming expertise. This flexibility empowers business users to explore data independently, ask iterative questions, and generate reports based on their findings. OLAP enhances decision-making by providing detailed insights and allowing users to drill down into specifics. For example, if an overall decrease in sales is noticed, users can drill down through the data to identify whether specific regions, time periods, or products are underperforming. Altaworx's experience with Grow BI tools illustrates how businesses can effectively utilize data to refine their strategies. By analyzing sales data, Altaworx identified that their best-selling product had the lowest profit margin. This insight enabled them to pivot their marketing efforts towards more profitable products, demonstrating the practical application of BI tools to drill down and pinpoint underperforming areas, thereby optimizing their sales strategy and impacting growth. Grow s No-Code Business Intelligence Platform takes this a step further by offering a user-friendly interface that allows users to perform sophisticated data analysis without any coding knowledge. decision-making processes and reduces reliance on IT departments. This accessibility speeds up 2. Enhancing Predictive Analytics
By using a data warehouse, BI tools enable businesses to perform historical data analysis, monitor current operations, and forecast future trends. The central repository ensures that all insights are based on the complete data set, enhancing the accuracy of reports generated by the dashboard business intelligence systems. OLAP allows users to view data from multiple perspectives, which is especially useful in dashboard business intelligence. For example, a financial manager might use OLAP within their BI tools to analyze expenses by department, region, and time period simultaneously. The use of OLAP in software for Business Intelligence accelerates data querying and analysis. This rapid processing allows business users to gain insights in real-time, supporting fast and informed decision-making. Furthermore, the multidimensional aspect of OLAP makes it an indispensable tool for users who need to perform complex, ad-hoc analyses on large scales. The strategic benefit of combining a data warehouse and OLAP, a company can use these features in their Business Intelligence tools to streamline operations, target customer segments more effectively, and optimize resource allocation all through the accessible interface of their BI dashboard software. 3. Real-Time Data Processing Stream processing is a technology designed to gracefully handle large streams of continuous data by processing data items sequentially and in real-time. This is crucial for Business Intelligence tools that require immediate analysis and reporting of data as it flows into the system. In software for Business Intelligence, stream processing allows for the continuous ingestion of data from various sources, such as online transactions, IoT devices, or live market data. This capability ensures that the data displayed on business intelligence dashboards is up-to-the-minute, reflecting current conditions without lag. Dashboard processing as it enables the dashboards to dynamically update with new information. This allows users to see trends develop in real-time, enhancing their ability to respond promptly to emerging patterns or issues. business intelligence benefits significantly from stream
Event-driven programming is another technology that enhances the real-time capabilities of BI tools. This approach allows programs to react to events as they occur, making it ideal for applications that depend on immediate data processing. Within Business Intelligence dashboard software, event-driven architectures trigger updates or actions based on specific data inputs or user interactions. For example, if a sales threshold is crossed or an inventory level drops below a certain point, the BI tool can automatically generate alerts or update the dashboard to reflect this change. The use of event-driven programming in software for Business Intelligence ensures that any change in data triggers immediate processing. This not only keeps the data fresh but also allows businesses to react instantaneously to critical events, from operational adjustments to strategic decision-making. 4. Democratizing Data Access Business Intelligence tools are designed with user-friendly interfaces that make the entirety of complex data operations a breeze. These interfaces typically feature drag-and-drop functionalities, pre-built templates, and intuitive controls that make it easy for non-technical users to create reports and dashboards. Software for Business Intelligence includes advanced visualization tools that allow users to create graphical representations of data through charts, graphs, and heat maps. These tools are equipped with guided analytics that suggest the best types of visualizations based on the data being analyzed. Self-service BI tools provide ad-hoc querying capabilities that let users ask and answer specific questions of their data on the fly. This is typically facilitated through a query builder that users can operate via simple point-and-click interfaces. This capability is crucial in Business Intelligence tools as it allows users to explore data beyond static reports, enabling dynamic exploration and instant insight generation based on current data inquiries. Businesses become more agile as decision-makers and frontline employees alike can generate and access insights independently, without waiting for IT or data team interventions.
Grows platform excels in self-service BI capabilities, offering drag-and-drop features helping users create customized reports and experience personalized dashboards. This initaites an inclusive approach to data and also enhances collaborative decision-making. 5. Advanced Data Visualization BI tools offer a wide array of visualization options that include basic charts (like bar, line, and pie charts), as well as more complex visualizations such as heat maps and scatter plots. These options are integrated into the software for business intelligence to cater to different analytical needs and preferences. Modern business intelligence tools provide high levels of customization in their visualization features. Users can adjust colors, scales, and labels to better align with their business branding or report requirements. Additionally, interactivity features such as tooltips, clickable legends, and drill-down capabilities are standard, allowing users to explore data more deeply directly from the visualization. The ability to customize and interact with visualizations directly on a business intelligence dashboard enhances user engagement and allows for more detailed data exploration. This functionality environments where decision-makers need to probe data at varying levels of granularity. is particularly useful in dynamic Visualizations in BI dashboard software are designed to be responsive, meaning they adjust to fit different screen sizes and devices without losing readability or functionality. Conclusion The modern business environment demands agility and precision qualities that are significantly enhanced by BI technologies. Whether through streamlining data integration, enhancing real-time analysis, or democratizing access to complex data insights, BI tools empower businesses of all sizes to harness their data effectively. The capacity to translate vast arrays of data into actionable strategies is what sets apart thriving businesses from the rest. However, adopting a data-driven mindset is only part of the journey. The tools you choose to analyze and interpret your data can define the success of your
business strategies. Grow BI tools offer a comprehensive suite that is intuitive enough for beginners yet powerful implementing Grow s solutions, businesses can ensure that their journey towards data-driven decision-making is both successful and scalable. enough for seasoned analysts. By Take Action Today If you're ready to elevate your business's approach to data and decision-making, why not start with Grow s 14-day free trial? Experience firsthand how our BI tools can transform your data into insights that drive action. For those interested in exploring further, we invite you to review the "Grow Pricing 2024 on Capterra" to find a plan that fits your business needs and budget. Embrace the power of data with Grow and start thinking like a data scientist today. Your business s future depends on the decisions you make now make sure they're informed by the best data insights available. Original Source: https://bit.ly/46hIbmQ


