Predator-Prey Relationship Analysis in Natural Environments

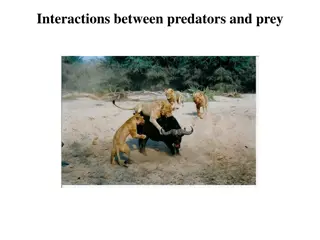
Explore the interconnected dynamics of predator and prey populations in a natural environment through a simulation study. Investigate the impact of this relationship on the negative feedback process over time. Plan variables, predict ratios, provide examples, list materials, and outline the procedure for conducting the simulation. Understand how predator-prey interactions influence population fluctuations and ecosystem stability.

Download Presentation

Please find below an Image/Link to download the presentation.
The content on the website is provided AS IS for your information and personal use only. It may not be sold, licensed, or shared on other websites without obtaining consent from the author. Download presentation by click this link. If you encounter any issues during the download, it is possible that the publisher has removed the file from their server.
E N D
Presentation Transcript
Predator/Prey Simulation Final Write up is due 9/16
Planning Purpose/Question: How does the predatory and prey relationship of ______ and _______ effect the negative feedback process seen in the natural environment? Hypothesis: The negative feedback process can be seen through the linked population fluctuations of predators and prey over time.
Planning Variables: To understand your ratios and variables, you will need to first research which predator and prey relationships you want to use. 1. Determine the Independent variable and the dependent variable 2. Decide which variables are constant, (ie the ratios, drop height, territory size etc.)
Planning Predicting ratios: Determine how many prey will feed 1 predator and keep them alive for 1 reproductive cycle. Determine how many prey will feed 1 predator in order to care for future offspring. Determine the reproduction ratio of prey and reproduction ratio of predators. Determine the counting of prey eaten by predator when landing on more than 1 prey.
Planning Examples of ratios: fox: hare Predator survival 1:2 Predatory survival and produces offspring for next trial 1:4 Reproduction rate of prey 2hares:4offspring Reproduction rate of predators 1parent:2 offspring Starting population sizes: 3:30 If all predators die, start next simulation with 3 predators
Planning Materials: Masking tape (for outline of territory) 24 - 2 X2 squares for predators 300 1 X1 squares for prey Notebook/graph paper for data table Pen or pencil for recording data
Planning (PL) Procedure: 1. Each lab group will need to research a specific predator and prey relationship including the population and territory size. Needs to also include how many prey a predator needs to eat to survive in the wild for one year and how much more prey is needed to produce and raise offspring. Set your parameters for the simulation as follows. Territory size - Shape Ratios of: 1. Start populations of predator: prey 2. Predator survival: prey eaten 3. Predator + offspring : prey eaten 4. Predator survival: predator offspring produced 5. Prey survival: prey offspring produced Drop height Using masking tape, outline your tiles and specific shape and area for your territory. Using a metric ruler (1m), stand it up in the middle of your territory and take your determined number of start prey and drop them from the center of territory all at once. (randomness is key) Using the metric ruler again, same as with prey, drop your pre-determined start population of predators into the territory. Determine the number of prey that has been eaten by each predator. Count the remaining prey within the territory and the surviving number of predators. Calculate the reproductive and survival ratios of the predator and prey. Record data. Add the new calculated number of prey offspring (if any) to your territory by the drop method listed in step 4 Add the new calculated number of predator offspring (or use start number of predators if all predators died), to your next drop/hunting group simulation. Repeat steps 4-10 for 25 simulations total (needed to see pattern). Each simulation represents one reproductive cycle of the predator. Graph the data and analyze the results. Write your findings and include your model limitations/evaluation and discussion in your conclusion. 1. 2. 1. 2. 3. 3. 4. 5. 6. 7. 8. 9. 10. 11. 12. 13.
Data: Population Changes of Predators and Prey Trials Starting Population of Predators Ending Population of Predators Starting Population of Prey Ending Population of Prey (reproductive cycle) 1 Pre-determined counted Pre-determined counted 2 calculated counted calculated counted 3 4 5 6 7 8 9 10. etc.
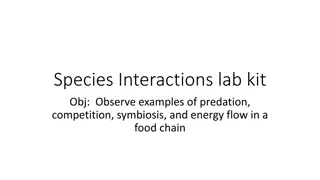
Analysis Graph the ending populations in one graph Graph calculated populations in a separate graph. Look for patterns (that is the analysis) Write a brief qualitative analysis of what the graphs are quantitatively showing. DO NOT forget to give titles to each graph and (figure1 etc) to the axis. Include units!
Example graph 200 150 predator 100 prey 50 predator 0 1 2 3 4 5 6 7 8 9 10 11 12
250 200 150 Series 2 Series 1 100 50 0 1 2 3 4 5 6 7 8 9 10 11 12 13 14 15


")