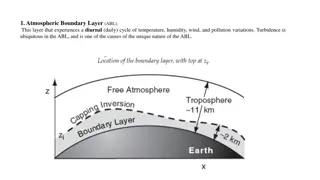
Fluctuating Intensity of Laser Beam in Marine Atmospheric Turbulence
Probability Density Function (PDF) reconstruction for the fluctuating intensity of a laser beam propagating in marine atmospheric turbulence involves experimental setup and calculations of statistical moments. Various models and methods are applied to reconstruct the PDF, crucial for solving inverse problems and understanding medium statistics. The Gamma-Laguerre model and processing procedures play a key role in this analysis.

Uploaded on Sep 17, 2024 | 0 Views
Download Presentation

Please find below an Image/Link to download the presentation.
The content on the website is provided AS IS for your information and personal use only. It may not be sold, licensed, or shared on other websites without obtaining consent from the author. Download presentation by click this link. If you encounter any issues during the download, it is possible that the publisher has removed the file from their server.
E N D
Presentation Transcript
Probability density function of fluctuating intensity of laser beam propagating in marine atmospheric turbulence Svetlana Avramov-Zamurovic, Reza Malek-Madani, U.S. Naval Academy Olga Korotkova, University of Miami
Goal: Probability Density Function reconstruction of the fluctuating beam intensity in atmospheric marine environment Experiment: Instrumentation set up in the field at the United States Naval Academy Measure intensity statistics of the beam in its transverse cross-section during daylight. Theory: Calculations of statistical moments of intensity Applying several PDF reconstruction models Comparison among the models and data sets
Probability Density Function PDF of fluctuating intensity P(I) shows with which chance the beam s intensity attains a certain level. b a = Probabilit ( y ) ( ) a I b P I dI P(I) 0 = ( ) l l I ( ) P I I dI I a b 0 Determination of the PDF from the moments is an academically noble problem: (famous Hausdorff moment problem) The knowledge of the PDF is crucial for solving inverse problems finding statistics of a medium The tails of the PDF affect the fade statistics of a signal encoded in a beam (BER errors in a communication channel)
Probability Distribution Function Reconstruction Methods Gamma distribution modulated by series of generalized Laguerre polynomials proposed by Barakat Medium and source independent Uses first n moments of detected intensity Valid in the presence of scatterers Gamma- Gamma distribution based on the work of Nakagami et. al. and presented by Andrews and Philips Medium and source dependent Uses 2 first moments Valid only in clear air atmosphere
Processing procedure 1. Calculation of statistical moments of fluctuating intensity from data Fluctuating intensity h k l ( k , ) h x y k k x Index of realization max = k = ( ) l ( , ) k h x y Total number of realizations Coordinates of the pixel max , y 1 max ( ) 2. Fitting the moments into the Probability Density Function = ( ) l l Note: ( ) h W h h dh
Gamma-Gamma Model Andrews and Phillips + + 2( ) 2 1 = ( ) (2 ) P I I K I 2 ( ) ( ) K ( ) x - Gamma-function ( ) x - Modified Bessel function of the second kind. m 1 1 = = ) 1 2 ln ) 1 2 ln exp( exp( y x 2 ln y 2 lnx and are normalized variances of the fluctuating intensity due to large and small turbulent inhomogeneities, respectively.
For the Gaussian beam model and the Kolmogorov power spectrum model: 2 B 0.51 + 2 B 0.49 = 2 ln = 2 ln y [1 0.69 + 12/5 5/6 B ] x [1 0.56(1 + 12/5 7/6 B ) ] 2 B 2 2 I I where is the normalized variance of fluctuating intensity in the center of the beam: = 2 B 2 I 1 for collimated beams, with L being propagation distance from the source to the receiver, k is wave number and W0 is the initial beam radius (after the expander). = 2 2 L + 1 2 kW 0
Comparison between Gamma-Laguerre and Gamma-Gamma Models Moments values provided by Barakat for both models Kolmogorov spectrum used for Gamma- Gamma model Source to target distance 400 m used in Gamma- Gamma model
College Creek Test College Creek site with 400 m long laser link. Experiment 18 June 2010. Source is low power ( 4 mW ) red He-Ne laser with an expander, creating 1 cm wide Gaussian beam. Target is a white board. Light intensities amplitude range of 255 was measured. Sequencing 30 frames per second three minutes of data collected. Pixel size was effectively measuring 0.3 mm2 . Spacial coherence radius for our Gaussian beam is on the order of 1 cm. Weather conditions at Hospital Point on June18, 2010 Sea Level Pressure Wind Speed Gust Speed Time Temp Humidity Wind Dir Conditions: 9:54 AM 73.0 F 57% 30.13 in North none none Clear 10:54 AM 75.0 F 53% 30.13 in none none none Clear
Data processing All of the realizations were added to create cumulative intensity plot, Pmax. Cumulative intensity plot From Pmax location with maximum intensity was determined, (xm, ym). Intensity vector , I, used for calculating PDF was formed by selecting intensity at the location (xm, ym) for each realization. Maximum intensity used for determination of (xm, ym).
Propagation above the water Gamma-Gamma PDF (blue) Gamma-Laguerre PDF (red) Intensity histogram (black stars) Normalized Intensity
Forest Sherman Field Test Target Source Forest Sherman Field site with 400 m long laser link. Experiment 15 June 2010. Source is low power ( 4 mW ) red He-Ne laser with an expander, creating 1 cm wide Gaussian beam. Target is a white board. Weather conditions at Hospital Point on June15, 2010 Sea Level Pressure Wind Speed Gust Speed Time Temp Humidity Wind Dir Conditions: Partly Cloudy Clear Mostly Cloudy 11:54 AM 79.0 F 62% 30.08 in NNE 8.1 mph none 12:54 PM 78.1 F 62% 30.08 in NNE 6.9 mph none 1:54 PM 77.0 F 66% 30.09 in North 6.9 mph none
Propagation above the land Gamma-Gamma PDF (blue) Gamma-Laguerre PDF (red) Intensity histogram (black stars)
Propagation above the water and above the land Land Water Normalized Intensity
College Creek/Forest Sherman Field Test Source Target College Creek/Forest Sherman field site with 500m long laser link. Experiments on November 14 2010. Source is low power (4 mW ) red He-Ne laser with an expander, creating 1 cm wide Gaussian beam. Target is ccd sensor with red notch filter. The sensing area is 7.6 mm (horizontal) 6.2 mm (vertical) with pixel size of 4.65 m. Weather conditions at Hospital Point on November 14, 2010 Sea Level Pressure 55.9 F 62% 30.04 in 55.9 F 62% 30.03 in Wind Speed 8.1 mph 6.9 mph Gust Speed none none Condition s: Clear Clear Time Temp Humidity Wind Dir 1:54 PM 2:54 PM ESE SE
Propagation on the boundary between the land and water (direct sensor measurements) Gamma-Gamma PDF (blue) Gamma-Laguerre PDF (red) Intensity histogram (black stars) Normalized Intensity
1. We measure Gaussian laser beam propagation over the land in the proximity of the water and above the water. 2. Based on two different methods, Gamma-Laguerre, and Gamma-Gamma we reconstruct from collected data the single-point Probability Density Function (PDF) of the fluctuating intensity of a laser beam propagating through the marine type atmospheric turbulence. 3. We present two ways of measuring light intensity at the target, namely (a) pictures of reflection of the beam off a white board and (b) capturing light intensity directly using ccd sensor. The later method leads to a more refined PDF. 4. We present comparison of models with data histogram and find good agreement. In particular, Gamma-Laguerre model emphasizes the tails agreeing better with data histogram. This can be due to prevailed water particle scattering and absorption above the water column which suppress optical intensity fluctuations. 5. Our results will find uses for any applications involving radiation transfer through marine-type atmospheric turbulence.
Fluctuating intensity of a laser beam propagating through ground and marine atmospheric channels was measured under weak atmospheric conditions. The data was fitted to the Barakat's model for the probability density function (PDF) which uses Gamma distribution for accounting for the first two statistical moments and generalized Laguerre polynomials for accounting for moments of orders higher than two. Comparison of the above-ground and the above- water PDFs is made and the dependence of the shape of the PDF of the intensity on the radial position within the propagating beam is revealed.