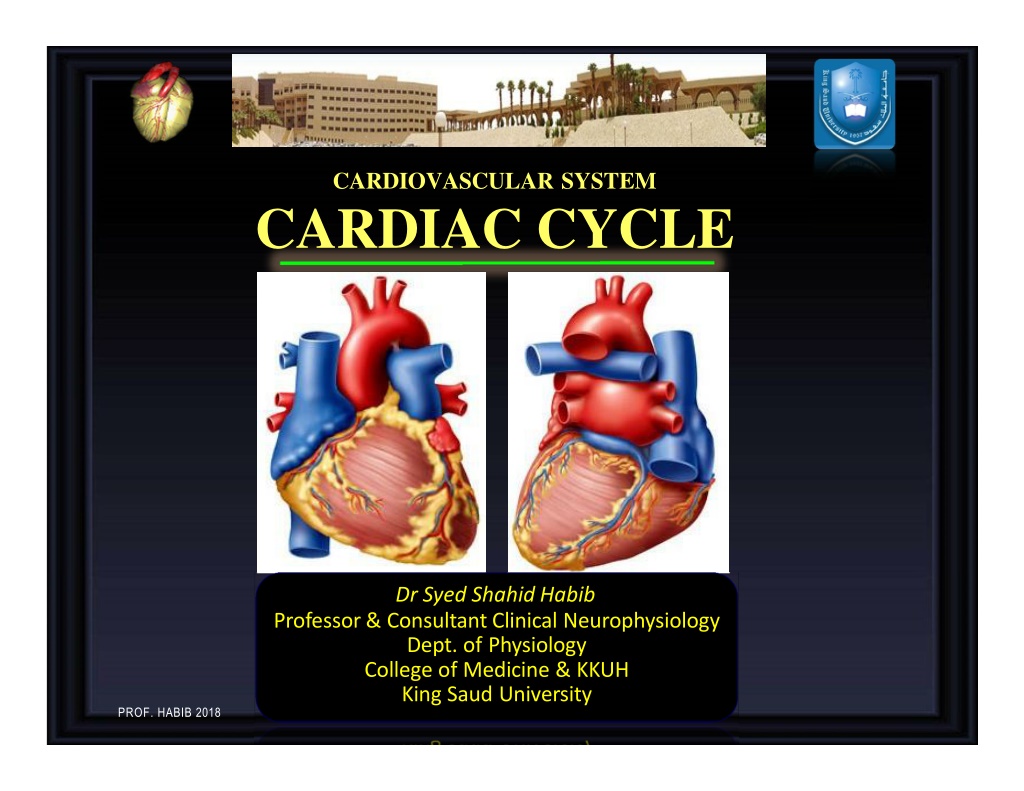
Understanding the Cardiac Cycle: Phases and Events Explained


CARDIOVASCULAR
SYSTEM
CARDIAC
CYCLE


Dr Syed
Shahid
Habib
Professor
&
Consultant
Clinical
Neurophysiology
Dept.
of
Physiology
College
of
Medicine
&
KKUH
King Saud
University
PROF.
HABIB
2018
O
B
J
E
C
T
I
V
E
S
1.
E
n
u
m
e
r
a
t
e
t
h
e
p
h
a
s
e
s
o
f
c
a
r
d
i
a
c
c
y
c
l
e
2.
E
x
p
l
a
i
n
t
h
e
e
f
f
e
c
t
o
f
h
e
a
r
t
r
a
t
e
o
n
d
u
r
a
t
i
o
n
o
f
s
y
s
t
o
l
e
a
n
d
d
i
a
s
t
o
l
e
3.
R
e
c
o
g
n
i
z
e
t
h
e
p
r
e
s
s
u
r
e
,
e
l
e
c
t
r
i
c
a
l
,
s
o
u
n
d
a
n
d
v
o
l
u
m
e
c
h
a
n
g
e
s
d
u
r
i
n
g
c
a
r
d
i
a
c
c
y
c
l
e
4.
C
o
r
r
e
l
a
t
e
d
i
f
f
e
r
e
n
t
p
h
a
s
e
s
o
f
c
a
r
d
i
a
c
c
y
c
l
e
w
i
t
h
v
a
r
i
o
u
s
c
h
a
n
g
e
s
i
n
e
v
e
n
t
s
.
5.
C
o
m
p
a
r
e
a
n
d
c
o
n
t
r
a
s
t
l
e
f
t
a
n
d
r
i
g
h
t
v
e
n
t
r
i
c
u
l
a
r
p
r
e
s
s
u
r
e
s
a
n
d
v
o
l
u
m
e
s
d
u
r
i
n
g
t
h
e
n
o
r
m
a
l
c
a
r
d
i
a
c
c
y
c
l
e
.
6.
D
e
s
c
r
i
b
e
a
t
r
i
a
l
p
r
e
s
s
u
r
e
w
a
v
e
s
&
t
h
e
i
r
r
e
l
a
t
i
o
n
s
h
i
p
t
o
c
a
r
d
i
a
c
c
y
c
l
e
7.
D
e
s
c
r
i
b
e
t
h
e
u
s
e
o
f
t
h
e
p
r
e
s
s
u
r
e
-
v
o
l
u
m
e
l
o
o
p
i
n
d
e
s
c
r
i
b
i
n
g
t
h
e
p
h
a
s
e
s
o
f
t
h
e
c
a
r
d
i
a
c
c
y
c
l
e
At the end
of
the lecture
you should be
able
to
…..
PROF.
HABIB
2018
S
O
U
R
C
E
G
U
Y
T
O
N
1
3
T
H
E
D
.
C
H
A
P
T
E
R
9
:
P
A
G
E
:
1
1
3
-
1
1
9
F
A
C
T
S
A
B
O
U
T
O
U
R
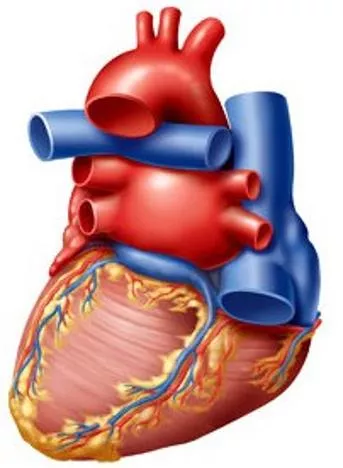
H
E
A
R
T
•
S
i
z
e
o
f
a
f
i
s
t
a
n
d
w
e
i
g
h
i
n
g
a
b
o
u
t
2
5
0
g
r
a
m
s
•
I
n
l
i
f
e
t
i
m
e
b
e
a
t
s
2
,
5
0
0
m
i
l
l
i
o
n
t
i
m
e
s
a
n
d
p
u
m
p
s
1
1
0
m
i
l
l
i
o
n
g
a
l
l
o
n
s
o
f
b
l
o
o
d
.
•
E
v
e
r
y
d
a
y
,
y
o
u
r
h
e
a
r
t
c
r
e
a
t
e
s
e
n
o
u
g
h
e
n
e
r
g
y
t
o
d
r
i
v
e
a
t
r
u
c
k
f
o
r
2
0
m
i
l
e
s
(
3
2
k
m
)
.
•
I
n
a
l
i
f
e
t
i
m
e
,
t
h
a
t
i
s
e
q
u
i
v
a
l
e
n
t
t
o
d
r
i
v
i
n
g
t
o
t
h
e
m
o
o
n
a
n
d
b
a
c
k
•
O
u
r
h
e
a
r
t
h
a
s
i
t
s
o
w
n
e
l
e
c
t
r
i
c
a
l
i
m
p
u
l
s
e
,
i
t
c
a
n
c
o
n
t
i
n
u
e
t
o
b
e
a
t
e
v
e
n
w
h
e
n
s
e
p
a
r
a
t
e
d
f
r
o
m
t
h
e
b
o
d
y
,
a
s
l
o
n
g
a
s
i
t
h
a
s
a
n
a
d
e
q
u
a
t
e
s
u
p
p
l
y
o
f
o
x
y
g
e
n
PROF.
HABIB
2018
CARDIAC
CYCLE
•
Definition:
Cardiac
Cycle is
the time
duration
comprising all the
events from
beginning
of
one
heart
contraction
to
the
beginning
of
next
heart
contraction.
•
At
heart
rate
of 75
beats per
minute
duration of
one
Cardiac
cycle is
0.8
second.
What are
the
Events?
PROF.
HABIB
2018
Mechanical
changes:
1.
Phases
of cardiac
cycle
2.
Heart
sounds
3.
Pressure
changes during
cardiac
cycle
4.
Volume
changes during
cardiac
cycle
Electrical
Changes
5.
Electrocardiogram
(ECG)
EVENTS
OF
CARDIAC
CYCLE
PROF.
HABIB
2018
The
Events
of
the Cardiac
Cycle
PROF.
HABIB
2018
Atrial
systole:
0.1
second
Atrial
diastole
:
0.7
seconds
Ventricular
Events
Ventricular
systole
:
0.3
seconds
Ventricular
diastole
:
0.5
seconds
PHASES
OF
CARDIAC
CYCLE
Atrial
Events
CARDIAC
CYCLE
0.8
SECONDS
PROF.
HABIB
2018
V
E
N
T
RICU
L
A
R
SYSTOLE
0.3
SECONDS
V
E
N
T
RICU
L
A
R
DIASTOLE
0.5
SECONDS
ATRIAL
SYS
T
O
L
E
0.1
SEC
ATRIAL
DIASTOLE
0.7
SECONDS
CARDIAC
CYCLE
0.8
SECONDS
PROF.
HABIB
2018
PROF.
HABIB
2018
•
Ventricular systole
1.
Isovolumetric
contraction
2.
Ejection
phase
Rapid
ejection
Slow
ejection
•
Ventricular
Diastole
1.
Isovolumetric
relaxation
phase
2.
Filling
phase
Rapid
filling
Slow
filling (Continued
filling)
Last
rapid
filling
(Atrial
Systole)
VENTRICULAR
EVENTS
PROF.
HABIB
2018
PHASES
OF
CARDIAC
CYCLE
PROF.
HABIB
2018
Importance of the long
ventricular
diastole?
This
is
important
for:
Coronary blood
flow &
Ventricular
filling
PROF.
HABIB
2018
PROF.
HABIB
2018
PROF.
HABIB
2018
PRESSURE
CHANGES
VARIOUS
PRESSURE
VALUES
PROF.
HABIB
2018
VOLUME
CHANGES
•
End
Diastolic
Volume:
Volume
of blood in
each
ventricle
at
the
end
of
diastole.
It
is about 110
–
120
ml.
•
End
Systolic
Volume:
Volume
of blood in
each
ventricle
at
the
end
of
Systole.
It
is about
40
to
50
ml
•
Stroke
Volume:
It
is
a
volume
of blood
pumped
out
by
each ventricle per
beat.
It
is about
70
ml.
Stroke
volume
(SV)
=
EDV
–
ESV
PROF.
HABIB
2018
EJECTION FRACTION
(EF) is
the
percentage
of
ventricular
end
diastolic volume
(EDV)
which
is
ejected
with each
stroke.
SV
or
(EDV
–
ESV)
X
100
EDV
75
X
100
=
62.5%
120
Normal ejection
fraction
is
about
60 – 65
%.
Ejection
fraction
is
good
index
of
ventricular
function.
PROF.
HABIB
2018
EF
=
ATRIAL
SYSTOLE
Atrial
Depolarization
Atrial
contraction
Atrial
pressures
rise
Blood flows
across
AV
valves
ATRIA
= PRIMER PUMPS
.
Ventricular
filling
:
•
80%
-
direct flow
from
SVC
&
IVC
•
20%
-
atrial
contraction.
PROF.
HABIB
2018
PROF.
HABIB
2018
Increase
in
ventricular
pressure
>
atrial
pressure
→
AV
valves
close
After
0.02s,
semilunar
valves
open
Period between
AV
valve
closure
and semilunar
valve
opening
→
heart
prepares
for
contraction
without
shortening→ occurs
without
emptying
Tension
develops
without
change
in
muscle
length
ISOVOLUMETRIC
CONTRACTION
PROF.
HABIB
2018
•
When
LV
pres
> 80
mm Hg
RV
pres
> 8
mm
Hg,
The
semilunar
valves
open.
•
Rapid
Ejection – 70%
emptying
in
first
1/3
duration
•
Slow
Ejection – 30% in
last
2/3
time
•
The
pressure
in the
ventricle
keeps
decreasing until
it
becomes lower
than
that
of the
great
vessels
EJECTION
PROF.
HABIB
2018
•
When
ventricle
pressure
<
arterial
pressure→
backflow of blood →
forces
semilunar
valves
to
close.
•
For
0.03-0.06 s,
ventricle
relaxes
despite
no
change
in its
volume
•
AV
and Semilunar
valves
are
closed
•
Meanwhile,
atria
fill up
and
atrial
pressure
gradually
rises
•
Pressures
in
ventricle
keep
falling
till
it is <
atrial
pressure
ISOVOULUMETRIC
RELAXATION
PROF.
HABIB
2018
•
Begins
with
the
opening
of
AV
valves
•
Rapid filling
–
first
1/3
of
diastole
(60-70%
blood)
•
Reduced
filling
(Diastasis)
–
middle
1/3
of
diastole
•
Atrial contraction
–
last
1/3
of
diastole
(27-30%
blood)
VENTRICULAR
FILLING
As
the
atrial pressures
fall,
the
AV
valves
close
and
left
ventricular volume
is
now
maximum →
EDV
(120
ml
in
LV)
PROF.
HABIB
2018
Aortic
Pressure
Curve
a.
Ascending
or
anacrotic
limb:
This coincides with
the
‘rapid
ejection
phase’
The
amount
of
blood
enters
aorta
>
leaves
Aortic
pressure
↑ up
to
120
mmHg
b.
Descending
or
catacrotic
limb:
(Has
4
stages)
Pulmonary artery
pressure changes
are
similar
to
the aortic
pressure
changes but
with
difference
in
magnitude. Normal
pulmonary
artery
pressure during
the
cardiac
cycle
≈
25-30/4-12
mmHg
Descending /
catacrotic
limb - 4
STAGES
1.
↓
Aortic
pressure:
This coincides
with the
‘reduced
ejection
phase’
The
amount
of
blood
enters
aorta
<
leaves
2.
Dicrotic
notch (incisura):
Due
to
closure
of aortic
valve
There
is sudden
drop
in aortic
pressure
This
notch
is
seen
in the aortic
pressure curve
at
end of
ventricular
systole
3.
Dicrotic
wave:
Due
to
elastic recoil
of the
aorta
Slight
↑
in aortic
pressure
4.
Slow
↓
aortic press: up
to
80
mmHg
Due
to
continued
flow of
blood
from
aorta
→
systemic
circulation
PROF.
HABIB
2018
Atrial pressure
changes during
the
cardiac
cycle
THE
JUGULAR
VENOUS
PULSE
(JVP)
PROF.
HABIB
2018
OF. HABIB
2018
The 3
wave
(a, c,
&
v)
are
equal
to
ONE
cardiac cycle
=
0.8
sec
Atrial pressure
changes during
the
cardiac
cycle
3
upward
waves:
a,
c, & v
waves
2
components
in
each
wave:
+ve
(↑ pr),
-ve
(↓
pr)
2
downward
deflection
(waves):
x & y
waves
PROF.
HABIB
2018
‘a’ wave:
Atrial systole:
↑
atrial pressure during atrial
contraction
‘c’
wave: Ventricular
systole
+ve
as a
result
of
bulging
of
AV
valve into
the
atria during
‘isovolumetric
contraction
phase’
-ve
as a
result
of
pulling
of the
atrial muscle
&
AV
cusps
down
during
‘rapid
ejection
phase’,
resulting
in
↓
atrial
pressure
‘v’
wave:
Atrial diastole
or
↑
venous
return
(VR)
+ve:
atrial pressure
↑
gradually due
to continuous
VR
-ve
as a
result
of
↓
atrial pressure during
‘rapid
filling
phase’
‘x’
descent:
Downward
displacement
of
AV
valves
during ‘reduced
ejection
phase’
‘y’
descent:
↓
atrial pressure during ‘reduced filling
phase’
Atrial pressure
waves
PROF.
HABIB
2018
CORRELATING
EVENTS
TOGETHER
2
6
PROF.
HABIB
2018
JVP
–
‘a’
wave
ECG
– P
wave
precedes the
atrial
systole.
PR
interval
–
depolarization
proceeds
to
the
AVN.
The
brief
pause
allows
complete ventricular
filling
Heart sounds
-
S
4
–
pathological.
Vibration
of the
ventricular
wall
during
atrial contraction. Heard in ‘stiff’
ventricle
like
in
hypertrophy
and
in
elderly.
Also heard in
massive
pulmonary embolism, cor pulmonale,
TR
A
T
R
I
A
L
S
Y
S
T
O
L
E
PROF.
HABIB
2018
JVP
–
‘c’
wave
→ due
to
the
bulging
of the
Tricuspid
valve
into
RA secondary
to
increased pressure
in the
ventricle.
ECG
– End of
QRS
complex
Heart
Sounds
–
S
1
:
closure
of the
AV
valves.
I
S
O
V
O
L
U
M
E
T
R
I
C
C
O
N
T
R
A
C
T
I
O
N
Volume
does not
change
All
valves
are
closed
PROF.
HABIB
2018
JVP
– no
waves
ECG
– T
wave
Heart
sounds
–
none
Aortic
pressure
-
Rapid
rise
in
the
pressure
= 120
mm
Hg.
Even
at
the end of
systole
pressure
in
the
aorta
is
maintained
at
90
mm Hg
because
of the
elastic
recoil
E
J
E
C
T
I
O
N
R
a
p
i
d
S
l
o
w
PROF.
HABIB
2018
JVP:
‘v’
wave
– due
to venous return to
the
atria
from
SVC
and
IVC
ECG:
End of T
wave
Heart
sounds:
S
2
:
closure
of the
semilunar
valves
coincides with
this
phase.
Aortic
pressure curve:
INCISURA
-
when
the
aortic
valve
closes.
Caused
by
a short
period
of
backflow
before
the
valve
closes
followed by
sudden cessation
of the
backflow when the
valve
closes.
I
S
O
V
O
L
U
M
E
T
R
I
C
R
E
L
A
X
A
T
I
O
N
Volume
does not
change
All
valves
are
closed
PROF.
HABIB
2018
V
E
N
T
R
I
C
U
L
A
R
F
I
L
L
I
N
G
PROF.
HABIB
2018
•
Rapid
filling
•
Reduced
filling
•
Atrial
contraction
JVP
–
‘y’
descent in
first
2/3
&
‘a’ wave
in
last
1/3
ECG
–
P
wave
before
atrial
systole
Heart sounds
-
S
3
-
Pathological
in adults.
Seen
in
dilated
congestive
heart
failure,
MI,
MR,
severe
hypertension.
Normal in
children.
PROF.
HABIB
2018
A
B
N
O
R
M
A
L
I
T
I
E
S
O
F
“
a
”
W
A
V
E
PROF.
HABIB
2018
•
E
l
e
v
a
t
e
d
a
w
a
v
e
T
r
i
c
u
s
p
i
d
s
t
e
n
o
s
i
s
D
e
c
r
e
a
s
e
d
v
e
n
t
r
i
c
u
l
a
r
c
o
m
p
l
i
a
n
c
e
(
v
e
n
t
r
i
c
u
l
a
r
f
a
i
l
u
r
e
,
p
u
l
m
o
n
i
c
v
a
l
v
e
s
t
e
n
o
s
i
s
,
o
r
p
u
l
m
o
n
a
r
y
h
y
p
e
r
t
e
n
s
i
o
n
)
•
C
a
n
n
o
n
a
w
a
v
e
A
t
r
i
a
l
-
v
e
n
t
r
i
c
u
l
a
r
a
s
y
n
c
h
r
o
n
y
(
a
t
r
i
a
c
o
n
t
r
a
c
t
a
g
a
i
n
s
t
a
c
l
o
s
e
d
t
r
i
c
u
s
p
i
d
v
a
l
v
e
)
c
o
m
p
l
e
t
e
h
e
a
r
t
b
l
o
c
k
,
f
o
l
l
o
w
i
n
g
p
r
e
m
a
t
u
r
e
v
e
n
t
r
i
c
u
l
a
r
c
o
n
t
r
a
c
t
i
o
n
,
d
u
r
i
n
g
v
e
n
t
r
i
c
u
l
a
r
t
a
c
h
y
c
a
r
d
i
a
,
w
i
t
h
v
e
n
t
r
i
c
u
l
a
r
p
a
c
e
m
a
k
e
r
•
A
b
s
e
n
t
a
w
a
v
e
A
t
r
i
a
l
f
i
b
r
i
l
l
a
t
i
o
n
o
r
a
t
r
i
a
l
s
t
a
n
d
s
t
i
l
l
A
t
r
i
a
l
f
l
u
t
t
e
r
“
V
o
l
u
m
e
-
P
r
e
s
s
u
r
e
D
i
a
g
r
a
m
”
D
u
r
i
n
g
t
h
e
C
a
r
d
i
a
c
C
y
c
l
e
;
C
a
r
d
i
a
c
W
o
r
k
O
u
t
p
u
t
.
PROF.
HABIB
2018
Both ventricular
systole
&
diastole
can
be
divided
into
early
&
late
phases.
Systole:
Early
systole
=
‘Isovolumetric
Contraction’.
Late
systole
=
Isotonic
Contraction
‘EjectionPhase’.
Diastole:
Early
diastole
=
‘IsovolumetricRelaxation’.
Late
diastole
=
Isotonic
Relaxation
‘Filling
Phase’.
PROF.
HABIB
2018
B
A
S
I
C
M
Y
O
C
A
R
D
I
A
L
M
U
S
C
L
E
M
E
C
H
A
N
I
C
S
:
→
LateDiastole
(Filling
phase)
VENTRICULAR
PRESSURE -
VOLUME
LOOP
Plots
LV
pressure
against
LV
volume
through
one
complete
cardiaccycle
Systole:
divided
into
Early
systole
Late
systole
Diastole:
divided
into
Early
diastole
Late
diastole
PROF.
HABIB
2018
SV
=
EDV
-
ESV
Systolic
BP
D
i
a
s
t
o
lic
BP
B
e
g
i
nn
i
n
g
of
Systole
ESV
EDV
End of
S
ys
t
o
le
C
ontr
act
ili
t
y
Area
=
Work
Compliance
VENTRICULAR
PRESSURE -
VOLUME
LOOP
a
.
I
n
c
r
e
a
s
e
d
p
r
e
l
o
a
d
:
n
r
e
f
e
r
s
t
o
a
n
i
n
c
r
e
a
s
e
i
n
e
n
d
-
d
i
a
s
t
o
l
i
c
v
o
l
u
m
e
a
n
d
i
s
t
h
e
r
e
s
u
l
t
o
f
i
n
c
r
e
a
s
e
d
v
e
n
o
u
s
r
e
t
u
r
n
.
c
a
u
s
e
s
a
n
i
n
c
r
e
a
s
e
i
n
s
t
r
o
k
e
v
o
l
u
m
e
b
a
s
e
d
o
n
t
h
e
F
r
a
n
k
–
S
t
a
r
l
i
n
g
r
e
l
a
t
i
o
n
s
h
i
p
…
.
r
e
f
l
e
c
t
e
d
i
n
i
n
c
r
e
a
s
e
d
w
i
d
t
h
o
f
t
h
e
p
r
e
s
s
u
r
e
–
v
o
l
u
m
e
l
o
o
p
.
b
.
I
n
c
r
e
a
s
e
d
a
f
t
e
r
l
o
a
d
r
e
f
e
r
s
t
o
a
n
i
n
c
r
e
a
s
e
i
n
a
o
r
t
i
c
p
r
e
s
s
u
r
e
.
n
T
h
e
v
e
n
t
r
i
c
l
e
m
u
s
t
e
j
e
c
t
b
l
o
o
d
a
g
a
i
n
s
t
a
h
i
g
h
e
r
p
r
e
s
s
u
r
e
,
r
e
s
u
l
t
i
n
g
i
n
a
d
e
c
r
e
a
s
e
i
n
s
t
r
o
k
e
v
o
l
u
m
e
…
.
i
s
r
e
f
l
e
c
t
e
d
i
n
d
e
c
r
e
a
s
e
d
w
i
d
t
h
o
f
t
h
e
p
r
e
s
s
u
r
e
–
v
o
l
u
m
e
l
o
o
p
.
T
h
e
d
e
c
r
e
a
s
e
i
n
s
t
r
o
k
e
v
o
l
u
m
e
r
e
s
u
l
t
s
i
n
a
n
i
n
c
r
e
a
s
e
i
n
e
n
d
-
s
y
s
t
o
l
i
c
v
o
l
u
m
e
.
EFFECT
OF
ATRIAL
CONTRACTION
ON
VENTRICLE
FILLING
At
rest,
atrial
contraction
adds little
extra
blood
to
the
ventricles.
When
the
heart
rate
is
high,
ventricle
filling
time
is
reduced.
During
exercise,
atrial
contraction
adds a
MORE
amount
of
blood
to
the
ventricles
.
PROF.
HABIB
2018
A
t
R
e
s
t
A
f
t
e
r
E
x
e
r
c
i
s
e
Hear
Rate
&
Cardiac
Cycle
PROF.
HABIB
2018
Hear
Rate
&
Cardiac
Cycle
PROF.
HABIB
2018
•
Higher
the
rate
lesser
is
duration
of
Cardiac
cycle.
•
However,
the
duration
of
systole
is much
more
fixed
than
that
of
diastole.
•
When
the
heart
rate
is
increased, diastole
is
shortened to
a
much
greater
degree.
For example,
at
a
heart
rate
of
65
beats/min,
the
duration
of
diastole
is 0.62
s,
whereas
at
a
heart
rate
of
200
beats/min,
it is
only
0.14
s.
Up
to
about
180/min,
filling
is
adequate
as
long
as
there
is enough
venous
return,
and
cardiac output
per
minute
is
increased
by
an
increase
in
rate.
However,
at
very
high
heart
rates,
filling may
be
compromised
to
such
a
degree
that cardiac output
per
minute
falls.
Physiologic
and
clinical implications
of
shortened diastole:
The heart
muscle
rests during diastole. Coronary blood
flows
to
the
subendocardial portions
of the
left
ventricle
only during
diastole. Furthermore, most
of the
ventricular
filling
occurs
in
diastole.
T
H
A
N
K
S
PROF.
HABIB
2018
Explore the intricate workings of the cardiac cycle, from the mechanical and electrical changes to the phases in both atria and ventricles. Learn about the time duration of a cardiac cycle, the impact of heart rate on systole and diastole, and various pressure, volume, and sound changes occurring during this vital process. Delve into fascinating facts about the heart and discover its incredible capabilities.

Download Presentation

Please find below an Image/Link to download the presentation.
The content on the website is provided AS IS for your information and personal use only. It may not be sold, licensed, or shared on other websites without obtaining consent from the author. Download presentation by click this link. If you encounter any issues during the download, it is possible that the publisher has removed the file from their server.
E N D
Presentation Transcript
CARDIOVASCULAR SYSTEM CARDIAC CYCLE Dr Syed ShahidHabib Professor & Consultant Clinical Neurophysiology Dept. of Physiology College of Medicine & KKUH King Saud University PROF. HABIB 2018
OBJECTIVES At the end of the lecture you should be able to .. 1. 2. 3. Enumerate the phases of cardiac cycle Explain the effect of heart rate on duration of systole and diastole Recognize the pressure, electrical, sound and volume changes during cardiac cycle Correlate different phases of cardiac cycle with various changes in events. Compare and contrast left and right ventricular pressures and volumes during the normal cardiac cycle. Describe atrial pressure waves & their relationship to cardiac cycle Describe the use of the pressure-volume loop in describing the phases of the cardiac cycle 4. 5. 6. 7. SOURCE GUYTON 13TH ED. CHAPTER9: PAGE:113-119 PROF. HABIB 2018
FACTS ABOUT OUR HEART Size of a fist and weighing about 250 grams In lifetime beats 2,500 million times and pumps 110 million gallons of blood. Every day, your heart creates enough energy to drive a truck for 20 miles (32 km). In a lifetime, that is equivalent to driving to the moon and back Our heart has its own electrical impulse, it can continue to beat even when separated from the body, as long as it has an adequate supply of oxygen PROF. HABIB 2018
CARDIAC CYCLE Definition: Cardiac Cycle is the time duration comprising all the events from beginning of one heart contraction to the beginning of next heart contraction. At heart rate of 75 beats per minute duration of one Cardiac cycle is 0.8 second. What are the Events? PROF. HABIB 2018
EVENTS OF CARDIAC CYCLE Mechanical changes: 1.Phases of cardiac cycle 2.Heart sounds 3.Pressure changes during cardiac cycle 4.Volume changes during cardiac cycle Electrical Changes 5.Electrocardiogram (ECG) PROF. HABIB 2018
The Events of the Cardiac Cycle PROF. HABIB 2018
PHASES OF CARDIAC CYCLE Atrial Events Atrial systole: 0.1 second Atrial diastole : 0.7 seconds Ventricular Events Ventricular systole : 0.3 seconds Ventricular diastole : 0.5 seconds CARDIAC CYCLE 0.8 SECONDS PROF. HABIB 2018
ATRIAL SYSTOLE 0.1 SEC ATRIALDIASTOLE 0.7 SECONDS VENTRICULAR SYSTOLE 0.3 SECONDS VENTRICULAR DIASTOLE 0.5 SECONDS CARDIAC CYCLE 0.8 SECONDS PROF. HABIB 2018
VENTRICULAR EVENTS Ventricular systole 1.Isovolumetric contraction 2.Ejection phase Rapid ejection Slow ejection Ventricular Diastole 1. Isovolumetric relaxation phase 2. Filling phase Rapid filling Slow filling (Continued filling) Last rapid filling (Atrial Systole) PROF. HABIB 2018
PHASES OF CARDIAC CYCLE PROF. HABIB 2018
VENTRICULAR SYSTOLE (Peak of R wave of QRS complex to the end of T wave) 0.31 sec ISO-VOLUMETRIC CONTRACTION 0.06 sec MAXIMUM EJECTION (2/3, 70%) 0.11 sec REDUCED EJECTION (1/3, 30%) 0.14 sec VENTRICULAR DIASTOLE (End of T wave to the peak of R wave of QRS complex) 0.52 sec ISO-VOLUMETRIC RELAXATION 0.06 sec RAPID INFLOW 0.11 sec SLOW INFLOW / DIASTASIS 0.2 sec ATRIAL SYSTOLE (after P wave) 0.11 sec 7 Phases of CARDIACCYCLE 0.8 sec Importance of the long ventricular diastole? This is important for: Coronary blood flow & Ventricular filling PROF. HABIB 2018
VARIOUS PRESSURE VALUES CHAMBERS NORMAL RANGE (mm ofHg) Right Atrium 2 8 Right Ventricle ( systolic) 15 25 (diastolic) 2 -8 Pulmonary Artery (systolic) 15 25 (diastolic) 8 - 15 Left Atrium 2-10 Left Ventricle (systolic) 100 120 (diastolic) 2 10 PROF. HABIB 2018
End Diastolic Volume: Volume of blood in each ventricle at the end of diastole. It is about 110 120 ml. End Systolic Volume: Volume of blood in each ventricle at the end of Systole. It is about 40 to 50 ml Stroke Volume: It is a volume of blood pumped out by each ventricle per beat. It is about 70 ml. Stroke volume (SV) = EDV ESV PROF. HABIB 2018
EJECTION FRACTION (EF) is the percentage of ventricular end diastolic volume (EDV) which is ejected with each stroke. SV or (EDV ESV) EF = X100 EDV 75 X 100 = 62.5% 120 Normal ejection fraction is about 60 65%. Ejection fraction is good index of ventricular function. PROF. HABIB 2018
ATRIAL SYSTOLE Atrial Depolarization Atrial contraction Atrial pressures rise Blood flows across AV valves ATRIA = PRIMER PUMPS . Ventricular filling : 80% - direct flow from SVC & IVC 20% - atrial contraction. PROF. HABIB 2018
ISOVOLUMETRIC CONTRACTION Increase in ventricular pressure> atrial pressure AV valves close After 0.02s, semilunar valves open Period between AV valve closure and semilunar valve opening heart prepares for contraction without shortening occurs without emptying Tension develops without change in musclelength PROF. HABIB 2018
EJECTION When LV pres > 80 mm Hg RV pres > 8 mmHg, The semilunar valvesopen. Rapid Ejection 70% emptyingin first 1/3duration Slow Ejection 30% in last 2/3time The pressure in the ventriclekeeps decreasing until it becomes lower than that of the great vessels PROF. HABIB 2018
ISOVOULUMETRIC RELAXATION When ventricle pressure < arterial pressure backflow of blood forces semilunar valves to close. For 0.03-0.06 s, ventriclerelaxes despite no change in its volume AV and Semilunar valves are closed Meanwhile, atria fill up and atrial pressure graduallyrises Pressures in ventricle keep falling till it is < atrial pressure PROF. HABIB 2018
VENTRICULAR FILLING Begins with the openingof AV valves Rapid filling first 1/3of diastole (60-70%blood) Reduced filling (Diastasis) middle 1/3 ofdiastole Atrial contraction last1/3 of diastole (27-30%blood) As the atrial pressures fall, the AV valves close and left ventricular volume is now maximum EDV (120 ml in LV) PROF. HABIB 2018
Aortic Pressure Curve a.Ascending or anacroticlimb: This coincides withthe rapid ejectionphase The amount ofblood enters aorta > leaves Aortic pressure upto 120 mmHg b.Descending orcatacrotic limb: (Has 4 stages) Pulmonary artery pressure changes are similar to the aortic pressure changes but with difference in magnitude. Normal pulmonary artery pressure during the cardiac cycle 25-30/4-12 mmHg
Descending / catacrotic limb - 4STAGES 1. Aortic pressure: This coincides with the reduced ejectionphase The amount of blood enters aorta < leaves 2. Dicrotic notch (incisura): Due to closure of aortic valve There is sudden drop in aortic pressure This notch is seen in the aortic pressure curve at end of ventricular systole 3. Dicrotic wave: Due to elastic recoil of the aorta Slight in aortic pressure 4. Slow aortic press: up to 80 mmHg Due to continued flow of blood from aorta systemiccirculation PROF. HABIB 2018
Atrial pressure changes during the cardiac cycle THE JUGULAR VENOUS PULSE (JVP) PROF. HABIB 2018
Atrial pressure changes during the cardiac cycle The 3 wave (a, c, & v) are equal to ONE cardiac cycle = 0.8sec 3 upwardwaves: a, c, & v waves 2 components ineach wave: +ve ( pr), -ve ( pr) 2 downwarddeflection (waves): x & ywaves PROF. HABIB 2018
Atrial pressure waves a wave: Atrial systole: atrial pressure during atrial contraction c wave: Ventricular systole +ve as a result of bulging of AV valve into the atria during isovolumetric contraction phase -ve as a result of pulling of the atrial muscle & AV cusps down during rapid ejection phase , resulting in atrial pressure v wave: Atrial diastole or venous return (VR) +ve: atrial pressure gradually due to continuous VR -ve as a result of atrial pressure during rapid filling phase x descent: Downward displacement of AV valves during reduced ejectionphase y descent: atrial pressure during reduced filling phase PROF. HABIB 2018
CORRELATING EVENTS TOGETHER 26 PROF. HABIB 2018
ATRIAL SYSTOLE JVP a wave ECG P wave precedes the atrial systole. PR interval depolarization proceeds to the AVN. The brief pause allows complete ventricular filling Heart sounds - S 4 pathological. Vibration of the ventricular wall during atrial contraction. Heard in stiff ventricle like in hypertrophy and in elderly. Also heard in massive pulmonary embolism, cor pulmonale, TR PROF. HABIB 2018
ISOVOLUMETRIC CONTRACTION Volume does not change All valves are closed JVP c wave due to the bulging of the Tricuspid valve into RA secondary to increased pressure in theventricle. ECG End of QRS complex Heart Sounds S1 : closure of the AVvalves. PROF. HABIB 2018
EJECTION Rapid Slow JVP no waves ECG T wave Heart sounds none Aortic pressure - Rapid rise in the pressure = 120 mm Hg. Even at the end of systole pressure in the aorta is maintained at 90 mm Hg because of the elastic recoil PROF. HABIB 2018
ISOVOLUMETRIC RELAXATION Volume does not change All valves are closed JVP: v wave due to venous return to the atria from SVC and IVC ECG: End of T wave Heart sounds: S2 : closure of the semilunar valves coincides with this phase. Aortic pressure curve: INCISURA - when the aortic valve closes. Caused by a short period of backflow before the valve closes followed by sudden cessation of the backflow when the valve closes. PROF. HABIB 2018
VENTRICULAR FILLING Rapid filling Reduced filling Atrial contraction JVP y descent in first 2/3 & a wave in last1/3 ECG P wave before atrial systole Heart sounds - S3- Pathological in adults. Seen in dilated congestive heart failure, MI, MR, severe hypertension. Normal inchildren. PROF. HABIB 2018
ABNORMALITIES OF a WAVE Elevated a wave Tricuspid stenosis Decreased ventricular compliance (ventricular failure, pulmonic valve stenosis, or pulmonary hypertension) Cannon a wave Atrial-ventricular asynchrony (atria contract against a closed tricuspid valve) complete heart block, following premature ventricular contraction, during ventricular tachycardia, with ventricular pacemaker Absent a wave Atrial fibrillation or atrial standstill Atrial flutter PROF. HABIB 2018
Volume-Pressure Diagram During the Cardiac Cycle; Cardiac Work Output. PROF. HABIB 2018
BASIC MYOCARDIAL MUSCLEMECHANICS: Both ventricular systole & diastole can bedivided into early & latephases. Systole: Earlysystole= IsovolumetricContraction . Late systole= Isotonic Contraction EjectionPhase . Diastole: Early diastole = IsovolumetricRelaxation . Late diastole= IsotonicRelaxation FillingPhase . PROF. HABIB 2018
VENTRICULAR PRESSURE - VOLUMELOOP Plots LV pressureagainst LV volume through one complete cardiaccycle Systole: divided into Early systole Late systole Diastole: dividedinto Early diastole Late diastole LateDiastole (Fillingphase) PROF. HABIB 2018
VENTRICULAR PRESSURE - VOLUMELOOP Systolic BP End of Systole Diastolic BP Contractility Area = Work Compliance Beginning of Systole EDV ESV SV = EDV - ESV
b. Increased afterload refers to an increase in aortic pressure. n The ventricle must eject blood against a higher pressure, resulting in a decrease in stroke volume .is reflected in decreased width of the pressure volume loop. The decrease in stroke volume results in an increase in end-systolic volume. a. Increased preload: n refers to an increase in end-diastolic volume and is the result of increased venous return. causes an increase in stroke volume based on the Frank Starling relationship .reflected in increased widthof the pressure volume loop.
EFFECT OF ATRIAL CONTRACTION ON VENTRICLE FILLING At rest, atrial contraction adds little extra blood to the ventricles. When the heart rate is high, ventricle filling time is reduced. During exercise, atrial contraction adds a MORE amount of blood to the ventricles. PROF. HABIB 2018
Hear Rate & Cardiac Cycle At Rest After Exercise PROF. HABIB 2018
Hear Rate & Cardiac Cycle Higher the rate lesser is duration of Cardiaccycle. However, the duration of systole is much more fixed than thatof diastole. When the heart rate is increased, diastole is shortened to a much greater degree. For example, at a heart rate of 65 beats/min, the duration of diastole is 0.62 s, whereas at aheart rate of 200 beats/min, it is only 0.14s. Up to about 180/min, filling is adequate as long as there is enough venous return, and cardiac output per minute is increased by an increase in rate. However, at very high heart rates, filling may be compromised to such a degree that cardiac output per minute falls. Physiologic and clinical implications of shortened diastole: The heart muscle rests during diastole. Coronary blood flows to the subendocardial portions of the left ventricle only during diastole. Furthermore, most of the ventricular filling occurs in diastole. PROF. HABIB 2018
THANKS PROF. HABIB 2018


 is the percentage of")