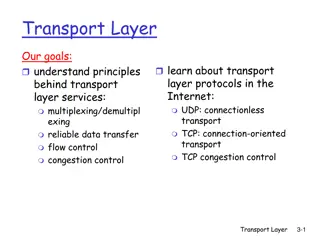
Understanding Advection and Retardation Processes in Environmental Transport
Explore how advection and retardation processes influence environmental transport, affecting the peak location and time distribution. Learn about linear equations, Greens functions, and spatial moments of a plume to characterize transport nature. Discover how moments centered around the plume's mass provide valuable insights into its behavior.

Download Presentation

Please find below an Image/Link to download the presentation.
The content on the website is provided AS IS for your information and personal use only. It may not be sold, licensed, or shared on other websites without obtaining consent from the author. Download presentation by click this link. If you encounter any issues during the download, it is possible that the publisher has removed the file from their server.
E N D
Presentation Transcript
Lets take everything we have learned so far and now add in the two other processes discussed in the introduction chapter advection and retardation
Solve Shifts the location of the peak
Solve Slows down time
As long as our governing equation is linear, yes you can always do it for a linear equation! And yes the ADE is linear. For the infinite domain the Greens function is given by
What if our domain is not infinite (like in the problems in HW2)? Well Polyanin s book has an entire section with Greens functions for those problems too
Finite Differences Random Walk
One of the features that is often used to characterize the nature of transport is the evolution of a plume s spatial moments. The nth moment of the plume is defined as What does this represent?
It is usually useful to measure moments centered about the center of mass of the plume
Zeroth (measures mass of system) Should be equal to 1 when normalized First Tells you the location of the center of mass of the plume Second Provides information about how wide the plume is (variance of the distribution) Third Provides information on how skewed a plume is .
When second centered moment scales linearly in time => Fickian Dispersion Anomalous/ Non-Fickian Dispersion Superdiffusion Subdiffusion
A geophysicist has provided you with the following plots of the first and second moment of a plume. Can you infer the advection speed and the dispersion coefficient?
Another, less common, but increasingly popular method is to look at temporal moments of breakthrough curves (i.e. you have a concentration measurement at a fixed distance x and integrate over time) It is often easier to measure breakthrough curves than spatial distribution of solutes and this information can also be used to infer parameters (such as v and D in the ADE).
The following breakthrough curve is measured in a stream 100 meters downstream of a location where you injected a pulse of a conservative solute. The mass you threw in is 1 kg. The data associated with this curve in available for download. From this breakthrough curve can you infer the velocity of the water in the stream is and what the dispersion coefficient for the solute is?


")
")