American Revolutionary War Infographic Timeline Project

American
Revolutionary War
Infographic Timeline
Cooperative Group
Project-based
Assessment
1775-1783
Time line Project Learning Objectives
Upon completion of this cooperative project- based
assessment, students will be able to:
1.) interpret timelines;
2.) relate information on a timeline to historical
events;
3.) develop and create an infographic timeline;
4.) present a visual chronological sequence of related
events along a drawn line;
5.) enable a quick visual understanding as a ‘snapshot’ of
how each event might impact on another event in time and
to assess students’ knowledge of the causes, people,
events
and effects of the American Revolution (1775-1783).
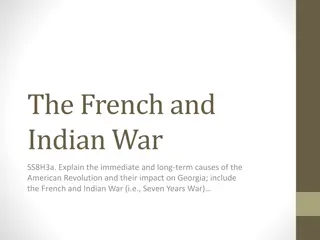
Sample
Infographic
Timeline
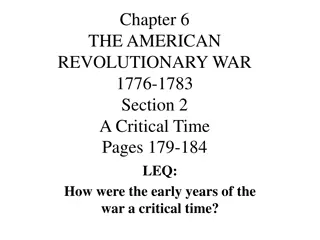
Another
Sample
Infographic
Timeline
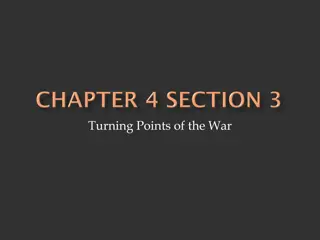
Your group will
create an
account on
Canva, chose a
free timeline
infographic
template, and
then create your
group’s
cooperative
project-based
assessment.
This project-based assessment focuses on creating an infographic timeline of the American Revolutionary War (1775-1783) to enhance students' understanding of historical events. Students will interpret timelines, present a visual sequence of events, and assess knowledge of causes, people, and effects of the war. Utilizing Canva's templates, the cooperative group project aims to develop skills in timeline interpretation and historical analysis.

Download Presentation

Please find below an Image/Link to download the presentation.
The content on the website is provided AS IS for your information and personal use only. It may not be sold, licensed, or shared on other websites without obtaining consent from the author. Download presentation by click this link. If you encounter any issues during the download, it is possible that the publisher has removed the file from their server.
E N D
Presentation Transcript
American Revolutionary War Infographic Timeline Cooperative Group Project-based Assessment 1775-1783
Time line Project Learning Objectives Upon completion of this cooperative project- based assessment, students will be able to: 1.) interpret timelines; 2.) relate information on a timeline to historical events; 3.) develop and create an infographic timeline; 4.) present a visual chronological sequence of related events along a drawn line; 5.) enable a quick visual understanding as a snapshot of how each event might impact on another event in time and to assess students knowledge of the causes, people, events and effects of the American Revolution (1775-1783).
Sample Infographic Timeline
Another Sample Infographic Timeline
Your group will create an account on Canva, chose a free timeline infographic template, and then create your group s cooperative project-based assessment.