Financial Update: Consolidated Statement of Comprehensive Income Summary (SOCI) - Year Ending 31 December 2020
Consolidated financial update for the year ending 31 December 2020 shows a shortfall in social housing lettings income due to delays in development progress. Operating profit and comprehensive income are impacted by variations in income and expenditures. Cost variances in social housing lettings and other activities are detailed, along with explanations on underspends and overspends. Shared ownership sales, net interest, and gains/losses on disposals also affect the financial results.
- Financial Update
- Consolidated Statement
- Comprehensive Income
- Social Housing Lettings
- Budget Variance

Download Presentation

Please find below an Image/Link to download the presentation.
The content on the website is provided AS IS for your information and personal use only. It may not be sold, licensed, or shared on other websites without obtaining consent from the author. Download presentation by click this link. If you encounter any issues during the download, it is possible that the publisher has removed the file from their server.
E N D
Presentation Transcript
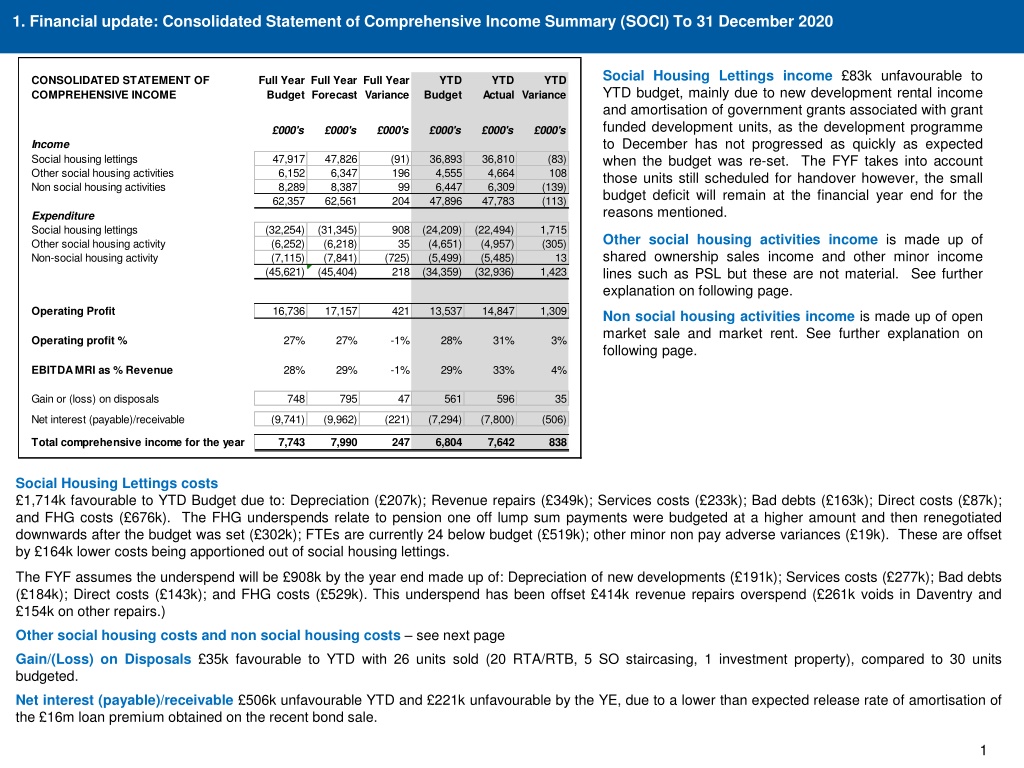
1. Financial update: Consolidated Statement of Comprehensive Income Summary (SOCI) To 31 December 2020 Social Housing Lettings income 83k unfavourable to YTD budget, mainly due to new development rental income and amortisation of government grants associated with grant funded development units, as the development programme to December has not progressed as quickly as expected when the budget was re-set. The FYF takes into account those units still scheduled for handover however, the small budget deficit will remain at the financial year end for the reasons mentioned. CONSOLIDATED STATEMENT OF COMPREHENSIVE INCOME Full Year Budget Full Year Forecast Full Year Variance YTD YTD Actual YTD Budget Variance 000's 000's 000's 000's 000's 000's Income Social housing lettings Other social housing activities Non social housing activities 47,917 6,152 8,289 62,357 47,826 6,347 8,387 62,561 (91) 196 99 204 36,893 4,555 6,447 47,896 36,810 4,664 6,309 47,783 (83) 108 (139) (113) Expenditure Social housing lettings Other social housing activity Non-social housing activity (32,254) (6,252) (7,115) (45,621) (31,345) (6,218) (7,841) (45,404) 908 35 (725) 218 (24,209) (4,651) (5,499) (34,359) (22,494) (4,957) (5,485) (32,936) 1,715 (305) Other social housing activities income is made up of shared ownership sales income and other minor income lines such as PSL but these are not material. See further explanation on following page. 13 1,423 16,736 17,157 421 13,537 14,847 1,309 Operating Profit Non social housing activities income is made up of open market sale and market rent. See further explanation on following page. 27% 27% -1% 28% 31% 3% Operating profit % 28% 29% -1% 29% 33% 4% EBITDA MRI as % Revenue Gain or (loss) on disposals 748 795 47 561 596 35 Net interest (payable)/receivable (9,741) (9,962) (221) (7,294) (7,800) (506) Total comprehensive income for the year 7,743 7,990 247 6,804 7,642 838 Social Housing Lettings costs 1,714k favourable to YTD Budget due to: Depreciation ( 207k); Revenue repairs ( 349k); Services costs ( 233k); Bad debts ( 163k); Direct costs ( 87k); and FHG costs ( 676k). The FHG underspends relate to pension one off lump sum payments were budgeted at a higher amount and then renegotiated downwards after the budget was set ( 302k); FTEs are currently 24 below budget ( 519k); other minor non pay adverse variances ( 19k). These are offset by 164k lower costs being apportioned out of social housing lettings. The FYF assumes the underspend will be 908k by the year end made up of: Depreciation of new developments ( 191k); Services costs ( 277k); Bad debts ( 184k); Direct costs ( 143k); and FHG costs ( 529k). This underspend has been offset 414k revenue repairs overspend ( 261k voids in Daventry and 154k on other repairs.) Other social housing costs and non social housing costs see next page Gain/(Loss) on Disposals 35k favourable to YTD with 26 units sold (20 RTA/RTB, 5 SO staircasing, 1 investment property), compared to 30 units budgeted. Net interest (payable)/receivable 506k unfavourable YTD and 221k unfavourable by the YE, due to a lower than expected release rate of amortisation of the 16m loan premium obtained on the recent bond sale. 1
1A. Further information on property sales Shared ownership sales profit Variances between budget and actual on the income line and expenditure line (affecting overall profit) for shared ownership sales are explained at the bottom of the table with reference to the three key drivers of variances: Number of units sold compared budget Average % sold compared to budget Average profit achieved per sale In addition to the above drivers, it should also be noted that the schemes which make up the budget sales units can sometimes be different to the schemes which make up the actual sales units. This can occur when some schemes slip in terms of completion date/sales date. It can also occur when a new scheme goes live that wasn t included in the original budget such as when the uncommittedunnamed development allocation gets allocated to a new scheme. YTD, the number of homes sold is on budget, but the profit achieved per sale is 2k per home below expectations. FYF, the number of homes sold is 2 higher than budget, the profit achieved per sale is 6k higher per home as the scheme mix making up the sales are weighted towards section 106 schemes (lower cost schemes). In addition, a 2% higher tranche sold was achieved compared to budget. OTHER SOCIAL HOUSING ACTIVITIES SUMMARY Full Year Budget Full Year Forecast Full Year Variance YTD YTD Actual YTD Budget Variance 000's 000's 000's 000's 000's 000's Other social housing activity income First tranche shared ownership sales Other Total 5,893 259 6,152 6,214 134 6,347 321 (125) 196 4,420 135 4,555 4,564 100 4,664 144 (36) 108 Other social housing activitiy costs First tranche shared ownership sales Other Total (4,917) (1,336) (6,252) (4,786) (1,431) (6,218) 131 (96) 35 (3,688) (964) (4,651) (3,933) (1,023) (4,957) (246) (60) (305) Shared ownership profit Other profit Other social housing activity surplus/(deficit) 976 1,427 (1,298) 129 451 (221) 230 732 (828) (96) 631 (923) (293) (102) (95) (197) (1,077) (101) Units sold Average % sold Average profit per home 68 70 2 51 51 0 47% 14 49% 20 2% 50% 14 50% 12 0% (2) 6 NON SOCIAL HOUSING ACTIVITY SUMMARY Full Year Budget Full Year Forecast Full Year Variance YTD YTD Actual YTD Budget Variance 000's 000's 000's 000's 000's 000's Non social housing activity income Properties developed for outright sale Other Total The variance in profit on other is due largely to PSL dilapidation costs. 5,603 2,686 8,289 5,973 2,415 8,387 370 (271) 4,419 2,028 6,447 4,493 1,816 6,309 74 (213) (139) 99 Outright sale Variances between budget and actual have the same three key drivers as explained above. YTD, the number of homes sold is higher than budget, as is the profit per home achieved. FYF, the number of homes sold is 1 higher than budget, but the average profit per home reduces. This is due to cost increases on the two schemes being sold- Danesby ( 60k) and Station Road (91k). Non social housing activity costs Properties developed for outright sale Other Total (4,622) (2,494) (7,115) (5,166) (2,675) (7,841) (544) (181) (725) (3,616) (1,882) (5,499) (3,457) (2,028) (5,485) 159 (146) 13 Outright sales profit per home Other profit Non social housing activity surplus/(deficit) 981 192 1,173 807 (260) 547 (174) (452) (627) 803 146 949 1,036 (212) 823 233 (359) (125) Units sold Average profit per home 26 38 27 30 1 20 40 23 45 3 5 (8) The variance in profit on other is due higher than expected voids on market rents (current performance is 8% but this has improved since quarter one which was 13% as a result of Covid-19 disruption.) In addition, there is slippage on market rent new development handovers as well as tenure changes since the budget was set, reducing the overall gross market rent income. 2
2. Financial update: Consolidated Statement of Financial Position (SOFP) To 31 December 2020 Fixed Assets are currently 16,664k lower than YTD budget due to development spend. The FYF shows the programme to be underspent by the year end. These underspends on existing schemes have been rolled forward into next financial year. Debtors current tenant arrears are expected to increase by the year end. Properties held for sale is forecast to decrease throughout the year as properties are sold coupled with slower build schedules. Cash and Investments favourablevariance due to development underspend. Current liabilities YTD variance is as a result of currently lower development spend than budgeted. It is expected to increase in the last quarter as development invoices come through. Loan arrangement fee These are made up of the fees incurred for refinances, and are released to the SOCI over the life of the debt. This balance will reduce to zero on expiry of the loan facilities/bond. Loan Premium & Amortisation The 50m retained bond was sold in June 2020. The interest rate associated with the 200m bond facility was fixed at 3.375% but due to preferential market conditions a lower rate was secured and a premium over and above the 50m cash receipt was obtained. This premium is then amortised over the life of the bond, as a credit to interest payable so the effective interest charge is 1.7% on the retained bond element. CONSOLIDATED STATEMENT OF FINANCIAL POSITION Full Year Budget 000's Full Year Forecast 000's Full Year Variance 000's YTD YTD Actual 000's YTD Budget 000's Variance 000's 336,367 322,912 (13,455) 324,346 307,683 (16,664) Fixed assets Current assets Debtors Stock Properties held for sale Cash Investments 4,600 139 1,958 16,852 41,000 6,718 139 1,871 15,407 55,499 2,118 7,767 139 3,316 23,596 41,730 5,672 140 3,125 25,421 55,499 (2,095) 0 1 (87) (191) 1,825 13,769 (1,445) 14,499 (17,095) (20,280) (3,185) (20,714) (17,452) 3,262 Current liabilities 47,455 59,354 11,899 55,833 72,404 16,571 Net current assets/(liabilities) 383,822 382,266 (1,556) 380,180 380,087 (93) Total assets less current liabilities Creditors due > 1 yr Long term loans Loan arrangement fees Loan arrangement fees amortisation Loan premium Loan premium amortisation Loan discount Loan discount amortisation Deferred capital grant Net pension liability Total net assets (3,436) (264,225) (264,225) 2,017 (386) (16,216) 678 891 (49) (38,926) (8,422) 55,748 (1,836) 1,600 (1,851) (1,850) 1 0 (264,225) (264,226) 0 2,017 (3) (367) 448 (15,708) (133) 0 891 0 (37) (470) (37,720) 0 (8,422) (114) 54,758 (1) 83 28 (61) 2,017 (390) (15,768) 2,100 (339) (15,768) 545 891 (49) 0 0 0 929 (24) 38 13 519 (39,396) (8,422) 55,634 (37,201) (8,422) 55,285 0 527 Capital and reserves Revenue reserves 55,748 55,634 (114) 54,758 55,285 527 Capital grants will increase as the Group progresses with grant funded schemes. It should be noted that business plans are not reliant on these grant monies being secured in order to meet future cash needs and loan covenants. Any confirmed grant not received this year will likely be received next financial year. The deferred grant balance is written down over a period of 100 years in line with the depreciation of housing structure. 3
3. Financial update: Group Statement of Cash Flows To 31 December 2020 Full Year Budget Full Year Forecast Full Year Variance YTD YTD Actual YTD Budget Variance CONSOLIDATED CASHFLOW STATEMENT 000's 000's 000's 000's 000's 000's Cash generated from operations the Group has generated c 21.5m cash from operations and by the year end is forecast to be 28.5m. Cash flow from investing activities The Group s main investment spend is on new development (c 10.8m) followed by capitalised repairs (c 3.9m), both of which are currently tracking under budget due to disruption caused by Covid-19. The development spend is currently forecast to be underspent at by the year end, whereas the capitalised repairs should largely meet the budgeted level. The Expenditure on other fixed assets includes the 1.2m spent on the new head office facility. 16,736 17,157 421 13,537 14,847 1,309 OPERATING PROFIT Adjustments for non cash items: Depreciation Amortisation of Government Grants (Increase)/decrease in debtors Increase/(decrease) in creditors (Increase)/decrease in stock of housing Cash generated from operations 7,301 (821) 2,395 (1,046) 4,476 29,040 7,165 (732) (2,286) 2,670 4,563 28,537 (136) 5,516 (615) 3,716 (3,983) 3,357 21,528 5,310 (542) (1,240) (158) 3,309 21,525 (207) 89 73 (4,681) 3,716 (4,956) 3,825 (48) 87 (503) (4) Cash flow from investing activities Capitalised repairs Income/(expenditure) on other fixed assets Development spend Grants and other income Proceeds from sale of fixed assets Interest received Cash (outflow)/inflow before interest (6,098) (6,632) (34,854) 6,146 1,259 (5,847) (6,524) (22,919) 6,057 2,243 251 108 (4,574) (4,910) (26,140) 4,609 (3,940) (2,694) (10,848) 3,673 1,320 634 2,216 15,292 (936) 1,044 11,934 (89) 984 276 0 0 (11,139) 1,546 12,685 (9,211) 9,035 18,246 (9,905) (9,962) (57) (4,686) (7,800) (3,114) Net interest paid TOTAL NET CASH INFLOW/ (OUTFLOW) FOR THE YEAR (21,044) (8,415) 12,628 (13,897) 1,235 15,132 The financing section reflects the 50m bond sale. Financed by: Increase/(decrease) in bank loans (Increase)/decrease in cash 23,089 (2,046) 21,044 24,925 (16,509) 8,415 1,835 (14,464) (12,628) 22,820 (8,923) 13,897 25,289 (26,524) (1,235) 2,468 (17,601) (15,132) 4