Understanding and Managing Hyperglycemic Crises: DKA and HHS

Hyperglycemic crises such as Diabetic Ketoacidosis (DKA) and Hyperglycemic Hyperosmolar State (HHS) are life-threatening emergencies characterized by severe hyperglycemia and metabolic imbalances. DKA involves absolute or near-absolute insulin deficiency leading to ketone body production and systemic acidosis, while HHS is marked by profound hyperglycemia and hyperosmolality due to relative insulin deficiency. These conditions have different onset durations and are more common in type 1 diabetes but are increasingly seen in type 2 diabetes. Prompt recognition and management are crucial to reduce mortality rates associated with these conditions.

Download Presentation

Please find below an Image/Link to download the presentation.
The content on the website is provided AS IS for your information and personal use only. It may not be sold, licensed, or shared on other websites without obtaining consent from the author. Download presentation by click this link. If you encounter any issues during the download, it is possible that the publisher has removed the file from their server.
E N D
Presentation Transcript
Diagnosis and Management of Hyperglycemic Crises Diabetic Ketoacidosis Hyperglycemic Hyperosmolar State 1
OVERVIEW 2
DKA and HHS Are Life-Threatening Emergencies Diabetic Ketoacidosis (DKA) Hyperglycemic Hyperosmolar State (HHS) Plasma glucose >250 mg/dL Plasma glucose >600 mg/dL Arterial pH <7.3 Arterial pH >7.3 Bicarbonate <15 mEq/L Bicarbonate >15 mEq/L Moderate ketonuria or ketonemia Minimal ketonuria and ketonemia Anion gap >12 mEq/L Serum osmolality >320 mosm/L 3
Characteristics of DKA and HHS Diabetic Ketoacidosis (DKA) Hyperglycemic Hyperosmolar State (HHS) Absolute (or near-absolute) insulin deficiency, resulting in Severe hyperglycemia Ketone body production Systemic acidosis Severe relative insulin deficiency, resulting in Profound hyperglycemia and hyperosmolality (from urinary free water losses) No significant ketone production or acidosis Develops over hours to 1-2 days Develops over days to weeks Most common in type 1 diabetes, but increasingly seen in type 2 diabetes Typically presents in type 2 or previously unrecognized diabetes Higher mortality rate 4
Definition of Diabetic Ketoacidosis* Acidosis * Ketosis Hyperglycemia Adapted from Kitabchi AE, Fisher JN. Diabetes Mellitus. In: Glew RA, Peters SP, ed. Clinical Studies in Medical Biochemistry. New York, NY: Oxford University Press; 1987:105. 5
Type 1 Diabetes Accounts for the Majority of Primary DKA Episodes Type 1 Diabetes Accounts for the Majority of Primay DKA Episodes Primary DKA Episodes 134,633 (2006 34% of episodes are Type 2 ~46,000 cases Longer Hospital Stays 4.2 vs average of 3.5 T1D - Children 18% 66% T1D - Adults 48% Very few have CV issues or serious infections => Less than 15% 34% T2D 34% T2D accounts for 34% of primary DKA cases and more than 50% of secondary causes National Hospital Discharge Survey (NHDS); 2006. National Hospital Discharge Survey. 2006. 6
Hospital Discharges for Diabetic Ketoacidosis (DKA) in the US In 2005, diagnosis of DKA was present on 120,000 discharges 7.4 discharges per 1000 DM patient population There was a higher rate of DKA for persons <age 45 55.4 discharges/1000 DM patient population (1987) 31.6 discharges/1000 DM patient population (2005) CDC. Diabetes Data and Trends. Hospitalization. Available from: http://www.cdc.gov/diabetes/statistics/hospitalization_national.htm#5 7
DKA Hospital Discharges in the US Growth in Incidence 1988-2009 160 1988: 80,000 discharges 2009: 140,000 discharges 140 Number (thousands) 120 100 80 60 40 20 0 CDC. Diabetes data and trends. Hospitalization: DKA. Available from: https://www.cdc.gov/diabetes/statistics/dkafirst/fig1.htm 8
DKA Mortality in the US Decline in Incidence 1988-2009 3500 1988: 3189 deaths 2009: 2417 deaths 3000 2500 Number 2000 1500 1000 500 0 CDC. Diabetes data and trends. DKA mortality. Available from: https://www.cdc.gov/diabetes/statistics/mortalitydka/fnumberofdka.htm. 9
Death Rates for Hyperglycemic Crises as Underlying Cause Rate per 100,000 Persons with Diabetes By Age, United States, 2009 25 20.7 20 Deaths per 100,000 14.8 15 11.1 10 6.5 5 0 0-44 45-64 65-71 75 Age (years) CDC. Diabetes complications. Mortality due to hyperglycemic crises. Available from: https://www.cdc.gov/diabetes/statistics/mortalitydka/fratedkadiabbyage.htm. 10
Hyperosmolality and Mortality in Hyperglycemic Crises Odds Ratios for Mortality 1,211 patients with Hyperglycemic crises Combined DKA-HHS in 27% DKA-HHS was independently associated with 2.4 fold increased mortality Case Definition of Hyperglycemic Crises 1) HHS: BG >600 mg/dL, effective osmolality 300 mOsm/L, bicarbonate >18 mEq/L 2) DKA: ICD-code for DKA and bicarbonate 18 mEq/L 3) Com bined DKA-HHS: DKA criteria + effective osmolality 300 mOsm/kg Pasquel FJ, et al. Presented at 76th Annual ADA Scientific Sessions, New Orleans, LA. June 10-14, 2016. Abstr 1482-P.
Causes of Morbidity and Mortality in DKA Shock Hypokalemia during treatment Hypoglycemia during treatment Cerebral edema during treatment Hypophosphatemia Acute renal failure Adult respiratory distress syndrome Vascular thrombosis Precipitating illness, including MI, stroke, sepsis, pancreatitis, pneumonia 12
PATHOGENESIS AND PATHOPHYSIOLOGY 13
Diabetic Ketoacidosis: Pathophysiology Unchecked gluconeogenesis Hyperglycemia Osmotic diuresis Dehydration Unchecked ketogenesis Ketosis Dissociation of ketone bodies into hydrogen ion and anions Anion-gap metabolic acidosis Often a precipitating event is identified (infection, lack of insulin administration) 14
Pathogenesis of Hyperglycemic Crises DKA HHS Hyperglycemia osmotic diuresis Dehydration Lipolysis- Increased FFA Increased glucose production Increased ketogenesis Counterregulatory Hormones Insulin Deficiency Decreased glucose uptake Metabolic acidosis Electrolyte abnormalities Hypertonicity Umpierrez G, Korytkowski M. Nat Rev Endocrinol. 2016;12:222-232. 15
Insulin Deficiency Hyperglycemia Hyper- osmolality Glycosuria MS Dehydration Electrolyte Losses Renal Failure CV Shock Collapse 16
Insulin Deficiency Lipolysis FFAs Ketones Acidosis CV Collapse 17
Insulin Deficiency Lipolysis Hyperglycemia Hyper- osmolality FFAs Glycosuria MS Ketones Dehydration Acidosis Electrolyte Losses Renal Failure CV CV Shock Collapse Collapse 18
Hyperosmolar Hyperglycemic State: Pathophysiology Unchecked gluconeogenesis Hyperglycemia Osmotic diuresis Dehydration Presents commonly with renal failure Insufficient insulin for prevention of hyperglycemia but sufficient insulin for suppression of lipolysis and ketogenesis Absence of significant acidosis Often identifiable precipitating event (infection, MI) 19
Diabetic Hyperglycemic Crises overlapping syndromes Diabetic Ketoacidosis (DKA) Hyperglycemic Hyperosmolar State (HHS) Younger, type 1 diabetes Older, type 2 diabetes No hyperosmolality Hyperosmolality Volume depletion Volume depletion Electrolyte disturbances Electrolyte disturbances Acidosis No acidosis 20
Predictors of Future Near-Normoglycemic Remission in Adults With DKA African-American, Hispanic, other minorities Newly diagnosed diabetes Obesity Family history of type 2 diabetes Negative islet autoantibodies Fasting C-peptide levels >0.33 nmol/L within 1 week or >0.5 nmol/L during follow-up Umpierrez GE, et al. Ann Intern Med. 2006;144:350-357. 21
Anion Gap Metabolic Acidosis The normal anion gap in mEq/L is calculated as: [Na] - [Cl + HCO3] The normal gap is <12 mEq/L Causes of anion gap acidosis (unmeasured anions) include: Ketoacidosis (diabetic, alcoholic) Lactic acidosis (lactate [underperfusion, sepsis]) Uremia (phosphates, sulfates) Poisonings/overdoses (methanol, ethanol, ethylene glycol, aspirin, paraldehyde) In ketoacidosis, the delta of the anion gap above 12 mEq/L is composed of anions derived from keto- acids 23
Hyperchloremic Metabolic Acidosis (Non-anion Gap) Hyperchloremic acidosis (ie, expansion acidosis) is common during recovery from DKA due to Fluid replacement with saline (NaCl) Renal loss of HCO3 Following successful treatment of DKA, a non- anion gap acidosis may persist after the ketoacidosis has cleared (ie, after closing of the anion gap) Closing of the anion gap is a better sign of recovery from DKA than is correction of metabolic acidosis 24
Ketone Bodies in DKA O O OH O O CH3 C CH2 C CH3 C CH2 C CH3 C CH3 O- H O- -Hydroxybutyrate Acetoacetate Acetone Unless -hydroxybutyrate ( -OH B) is specifically ordered, the ketone bodies are estimated by the nitroprusside reaction in the lab, which measures only acetone and acetoacetate (AcAc) Acetone is not an acid 25
Ketone Body Equilibrium in DKA -OH B AcAc NADH + H+ NAD+ In DKA, the dominant ketoacid is -hydroxybutyric acid ( -OH B), especially in cases of poor tissue perfusion/lactic acidosis During recovery, the balance shifts to acetoacetic acid (AcAc) 26
Significance of Ketone Measurements -hydroxybutyrate can only be measured using specialized equipment not available in most in- house laboratories During recovery, results from the nitroprusside test might wrongly indicate that the ketone concentration is not improving or is even getting worse The best biochemical indicator of resolution of keto- acid excess is simply the anion gap There is no rationale for follow-up ketone measurements after the initial measurement has returned high 27
Coexisting Conditions (Altered Redox States) Drive Balance Toward NADH and -OH B Lactic Acidosis Alcoholic Ketoacidosis Fulop M, et al. Arch Intern Med. 1976;136:987-990; Marliss EB, et al. N Engl J Med. 1970;283:978-980; Levy LJ, et al. Ann Intern Med. 1973;79:213-219; Wrenn KD, et al. Am J Med. 1991;91:119-128. 28
Molar Ratio of -OH B to AcAc 2 to 1 Normal health 3-4 to 1 DKA 7.7-7.8 to 1 DKA with high redox state Significance: Increase of measured ketones may be misleadingly small in DKA with coexisting lactic acidosis and/or alcoholism Marliss EB, et al. N Engl J Med. 1970;283:978-980. 29
Clinical Presentation of Diabetic Ketoacidosis History Physical Exam Kussmaul respirations Fruity breath Relative hypothermia Tachycardia Supine hypotension, orthostatic drop of blood pressure Dry mucous membranes Poor skin turgor Thirst Polyuria Abdominal pain Nausea and/or vomiting Profound weakness Patients with any form of diabetes who present with abdominal pain, nausea, fatigue, and/or dyspnea should be evaluated for DKA. Handelsman Y, et al. Endocr Pract. 2016;22:753-762. 31
Lab Findings in DKA Hyperglycemia Usually >250 mg/dL Lower blood glucose values possible, especially under metabolically stressful conditions (eg, prolonged fasting, carbohydrate avoidance, extreme sports/physical exertion, myocardial infarction, stroke, severe infection, surgery) Increased blood and urine ketones High -hydroxybutyrate High anion gap Low arterial pH Low PCO2 (respiratory compensation) Handelsman Y, et al. Endocr Pract. 2016;22:753-762. 32
Potassium Balance in DKA Potassium is dominantly intracellular Urinary losses occur during evolution of DKA (due to glycosuria) Total body potassium stores are greatly reduced in any patient with DKA Potassium moves from inside the cell to the extracellular space (plasma) During insulin deficiency In presence of high blood glucose As cells buffer hydrogen ions Blood levels of potassium prior to treatment are usually high but may drop precipitously during therapy 33
Clinical Presentation of Hyperglycemic Hyperosmolar State Compared to DKA, in HHS there is greater severity of: Dehydration Hyperglycemia Hypernatremia Hyperosmolality Because some insulin typically persists in HHS, ketogenesis is absent to minimal and is insufficient to produce significant acidosis 34
Clinical Presentation of Hyperglycemic Hyperosmolar State Patient Profile Disease Characteristics More insidious development than DKA (weeks vs hours/days) Greater osmolality and mental status changes than DKA Dehydration presenting with a shock-like state Older More comorbidities History of type 2 diabetes, which may have been unrecognized 35
Electrolyte and Fluid Deficits in DKA and HHS Parameter DKA* HHS* Water, mL/kg 100 (7 L) 100-200 (10.5 L) Sodium, mmol/kg 7-10 (490-700) 5-13 (350-910) Potassium, mmol/kg 3-5 (210-300) 5-15 (350-1050) Chloride, mmol/kg 3-5 (210-350) 3-7 (210-490) Phosphate, mmol/kg 1-1.5 (70-105) 1-2 (70-140) Magnesium, mmol/kg 1-2 (70-140) 1-2 (70-140) Calcium, mmol/kg 1-2 (70-140) 1-2 (70-140) * Values (in parentheses) are in mmol unless stated otherwise and refer to the total body deficit for a 70 kg patient. Chaisson JL, et al. CMAJ. 2003;168:859-866. 36
Initial Laboratory Evaluation of Hyperglycemic Emergencies Comprehensive metabolic profile Serum osmolality Serum and urine ketones Arterial blood gases Lactate (?) CBC Urinalysis ECG Blood cultures (?) 37
Laboratory Diagnostic Criteria of DKA and HHS Parameter Normal range DKA HHS Plasma glucose, mg/dL 76-115 250* 600 Arterial pH 7.35-7.45 7.30 >7.30 31 (children) 40 (adults) -Hydroxybutyrate, mg/dL 4.2-5.2 Serum bicarbonate, mmol/L 22-28 18 >15 Effective serum osmolality, mmol/kg 275-295 320 >320 Anion gap, mmol/L <10 >10 Variable Serum ketones Negative Positive None or trace Urine ketones Negative Moderate to high None or trace *May occur at lower glucose values, especially under physiologically stressful conditions. If venous pH is used, a correction of 0.03 must be made. Suggestive but not diagnostic of DKA. Calculation: (Na+) [Cl- + HCO3- (mEq/L)]. Nitroprusside reaction method. Chaisson JL, et al. CMAJ. 2003;168:859-866. Handelsman Y, et al. Endocr Pract. 2016;22:753-762. Haw SJ, et al. In: Managing Diabetes and Hyperglycemia in the Hospital Setting: A Clinician s Guide. Draznin B, ed. Alexandria, VA: American Diabetes Association; 2016;284-297. 38
ADA Diagnostic Criteria for DKA and HHS DKA Parameter Mild Moderate Severe HHS Plasma glucose, mg/dL >250 >250 >250 >600 Arterial pH 7.25-7.3 7.0-7.24 <7.0 >7.30 Serum bicarbonate, mmol/L 15-18 10 to <15 <10 >15 Serum ketones Positive Positive Positive Small Urine ketones Positive Positive Positive Small Effective serum osmolality,* mOsm/kg Variable Variable Variable >320 Alteration in sensoria or mental obtundation Alert Alert/drowsy Stupor/coma Stupor/coma *Calculation: 2[measured Na+ (mEq/L)] + glucose (mg/dL)/18. Nitroprusside reaction method. ADA. Diabetes Care. 2003;26:S109-S117. 39
Formulas for Estimating Serum Osmolality and Effective Osmolality Osmolality Effective Osmolality 2 x [Na+ mEq/L] 2 x [Na+ mEq/L] + [glucose mg/dL] / 18 + [glucose mg/dL] / 18 + [BUN mg/dL] / 2.8 = Sosm (mosm/Kg H2O) = Sosm (mosm/Kg H2O) 40
Mental Status at DKA Presentation Level of Consciousness Mental Status and Osmolality 350 Serum osmolality (mmol/kg) 340 330 Lethargy, 39% Alert, 48% 320 P<0.01 310 Coma, 13% 300 290 Comatose Not comatose Umpierrez GE, et al. Arch Intern Med. 1997;157:669-675.
DKA and Abdominal Pain Presenting With Abdominal Pain (n=86) Presenting Without Abdominal Pain (n=103) Characteristic Age, years 37 1 41 2 Male gender, n 47 64 History of alcohol use, % 51* 24 History of cocaine use 13 2 Blood glucose, mg/dL 596 586 Bicarbonate, mmol/L 9 1* 15 1 Ph 7.12 0.02* 7.24 0.09 Sodium, mmol/L 133 1 133 1 Serum osmolality, mmol/L 307 2 307 2 *P<0.05. P<0.01. P<0.0001. Umpierrez G, Freire AX. J Crit Care. 2002;17:63-67.
Clinical Characteristics of DKA Patients Presenting With Abdominal Pain With abdominal pain Without abdominal pain 100% 90% 86 80% 70% 66 60% Patients 58 50% 54 50 48 40% 40 36 36 30% 20% 10% 13 0% <5 5 to <10 10 to <15 15-18 <400 400-600 >600 <300 300-320 >320 Bicarbonate Glucose Serum Osmolality *P<0.05. P<0.01. P<0.0001. Umpierrez G, Freire AX. J Crit Care. 2002;17:63-67.
TREATMENT RECOMMENDATIONS 44
Management of DKA and HHS Replacement of fluids losses Correction of hyperglycemia/metabolic acidosis Replacement of electrolytes losses Detection and treatment of precipitating causes Conversion to a maintenance diabetes regimen (prevention of recurrence) Kitabchi AE, et al. Diabetes Care. 2009;32:1335-1343.
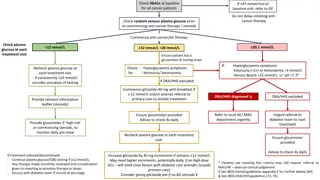
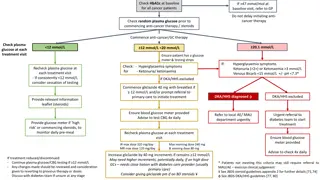
Fluid Therapy in DKA Normal saline, 1-2 L over 1-2 h Calculate corrected serum sodium High or normal serum sodium Low serum sodium NS at 250-500 mL/h NS at 250-500 mL/h Glucose < 250 mg/dl Change to D5% NS or 1/2NS ADA. Diabetes Care. 2003;26:S109-S117.
Suggested Initial Rate of Fluid Replacement* Hours Volume 1st hour 1000 2,000 mL 2nd hour 1000 mL 3rd-5th hours 500 1000 mL/hour 6th-12th hours 250 500 mL/hour *Average replacement after initial hemodynamic resuscitation with normal saline when indicated Chaithongdi N et al. Hormones (Athens). 2011;10:250-260. 47
Intravenous Insulin Therapy in DKA IV bolus: 0.1 U/kg body weight IV drip: 0.1 U/kg/h body weight Glucose < 250 mg/dl IV drip: 0.05 0.1 U/kg/h until resolution of ketoacidosis ADA. Diabetes Care. 2003;26:S109-S117.
Potassium Repletion in DKA Life-threatening hypokalemia can develop during insulin treatment Potassium reenters cells with insulinization and correction of acidosis The small extracellular compartment experiences a precipitous drop of potassium concentration Anticipatory potassium replacement during treatment of DKA is almost always required 49
Potassium Replacement K+ = > 5.5 mEq/L: no supplemental is required K+ = 4 - 5 mEq/L: 20 mEq/L of replacement fluid K+ = 3 - 4 mEq/L: 40 mEq/L of replacement fluid If admission K+ = <3 mEq/L give 10-20 mEq/h until K+ >3 mEq/L, then add 40 mEq/L to replacement fluid ADA. Diabetes Care. 2003;26:S109-S117.