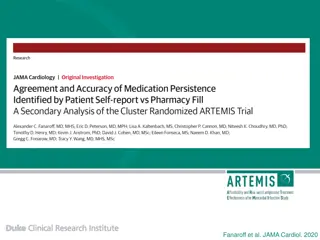
Comparison of Persistence on Guideline-Recommended HIV Treatment Among US Medicaid Beneficiaries
This study compares the persistence rates of newer DHHS guideline-recommended single- and multiple-tablet regimens for treatment-naive patients living with HIV. The analysis utilized the All-Payer Claims Database to assess treatment patterns among Medicaid beneficiaries, highlighting the importance of adherence to ART regimens. The study provides valuable insights into medication adherence among the HIV population in the US.

Uploaded on Oct 07, 2024 | 0 Views
Download Presentation

Please find below an Image/Link to download the presentation.
The content on the website is provided AS IS for your information and personal use only. It may not be sold, licensed, or shared on other websites without obtaining consent from the author. Download presentation by click this link. If you encounter any issues during the download, it is possible that the publisher has removed the file from their server.
E N D
Presentation Transcript
Persistence on Guideline-Recommended HIV Treatment: Comparison Among US Medicaid Beneficiaries Newly Initiating Treatment with Single- versus Multiple-Tablet Regimens Dylan Mezzio,1Joshua Gruber,1Woodie Zachry,1Ishveen Chopra,2Qiao Mu,2Vasantha Pedarla,2Joshua Cohen3 1Gilead Sciences, Inc., Foster City, CA, USA; 2StatInMed, Plano, TX, USA; 3Tufts University, Boston, MA, US
Introduction There is a paucity of persistence data on adult US Medicaid beneficiaries living with HIV that detail the Department of Health & Human Services (DHHS) guideline-recommended antiretroviral treatment (ART) regimens.1 2 Confidential Internal Use Only
Objective The purpose of this study is to compare the persistence newer DHHS guideline-recommended single- and multiple-tablet regimens (STRs and MTRs) for treatment-na ve patients. 3 Confidential Internal Use Only
Methods A retrospective analysis was conducted using the All-Payer Claims Database (APCD) for persons living with HIV initiating ART between Jan 1, 2017, and Mar 31, 2020, with 12 months continuous capture pre- and post- index date. APCD provides insight into nearly 80% of the US health care system; 300 million unique patients across all payers. APCD is nationally representative of the US population and includes patients from all geographic regions, providing comprehensive insight into treatment patterns among the Medicaid population. Index date was defined as the date of the first ART claim For STRs, the date of the first ART claim within the period Jan 1, 2017 March 31, 2020, was the index date For MTRs, the fill date for the last medication in the regimen was the index date ( 5-day window between fills for components comprising the regimen was allowed). Persistence was measured from the index date until treatment discontinuation ( 90-day gap between fills of index regimen) or the end of the study period, whichever occurred first. For MTRs, patients must remain on all therapies in the initial regimen to be counted as persistent. Patient selection criteria presented in Figure 1. 4
Figure 1: Sample Selection 2 prescription claims for an ART of interest during the identification period [Jan 1, 2017 Mar 31, 2020] (N= 111,035) Alive at any point during the 12-month pre and post index period (N= 110,614) 12 months continuous capture pre- and post-index date; 1 pharmacy or medical claim at any point during the 12-month period (N= 97,091) Aged 18 years as of the index date (N= 96,360) Only 1 regimen at index date (N=3,296) ART use in the 12 months prior to the index date (N=47,201) HIV-2 diagnosis claim during baseline period (on or 12 months prior to index date) (N=196) ART use other than index drugs on the index date (N=203) Excluded (N=51,596) Patients remaining in sample (N=44,764) Patients who received STR as index regimen (N=34,787) Patients who received MTR as index regimen (N=9,977)
Table 1: Patient Distribution STRs & MTRs STRs (N=34,787) MTRs (N=9,977) Regimen N % Regimen N % B/F/TAF FTC/TDF+DTG 9052 26.02% 2122 21.27% DTG/3TC FTC/TAF+DTG 157 0.45% 5487 55.00% DTG/RPV 3TC/TDF+DTG 424 1.22% 1 0.01% DTG/ABC/3TC FTC/TDF+RAL 7384 21.23% 1697 17.01% EVG/COBI/FTC/TAF FTC/TAF+RAL 9500 27.31% 657 6.59% EVG/COBI/FTC/TDF FTC/TDF+DRV/r,c* 1569 4.51% 3 0.03% RPV/FTC/TAF FTC/TAF+DRV/r,c* 2699 7.76% 7 0.07% RPV/FTC/TDF FTC/TDF+ATV/r,c* 1112 3.20% 2 0.02% EFV/FTC/TDF FTC/TAF+ATV/r,c* 1986 5.71% 1 0.01% EFV/3TC/TDF 9 0.03% DRV/c/r/FTC/TAF 873 2.51% DOR/3TC/TDF 22 0.06% ABC: Abacavir, ATV: Atazanavir, B: Bictegravir, COBI or /c: Cobicistat, DOR: doravirine, DRV: Darunavir, DTG: Dolutegravir, EFV: Efavirenz, EVG: Elvitegravir, F: Emtricitabine, FTC: Emtricitabine, MTR: multiple-tabled regimen, RAL: Raltegravir, RPV: Rilpivirine, r: Ritonavir, STR: single-tablet regimen, TAF: Tenofovir alafenamide fumarate, 3TC: Lamivudine, TDF: Tenofovir disoproxil fumarate Boosted with cobicistat or ritonavir. Patient distribution by DHHS-recommended Initial ART regimens 6 Confidential Internal Use Only
Results: Baseline Demographics and Clinical Characteristics (Table 2) We identified 44,764 (STRs=34,787; MTRs=9,977) Medicaid beneficiaries who newly initiated ART. Sample average age was 44 12 years, was predominantly male (65%), and resided in the southern US (37%). In the 12-month pre-index period, the most used drug classes were respiratory drugs (6%), antibiotics (5%), antipsychotics (5%), and antihypertensives (5%).
Table 2: Baseline Demographics and Clinical Characteristics Demographics and Clinical Characteristics Total (N=44,764) STR (N=34,787) MTR (N=9,977) 43.5 (12.4) 43.7 (12.3) 42.6 (12.8) Age, mean (SD) 18-34 years 35-49 years 50-64 years 65 years Gender (n,%) Male Female US Geographic Region (n, %) Northeast North Central South West Other Pre-index medication use (n, %) Antihypertensives Antidiabetics Anticoagulants Lipid-lowering therapy Antibiotics Respiratory drugs Antipsychotics Number of unique medications on index date (n, %) Patients with only ART on the index date Patients with 1 non-ART on the index date Post-index observation days, mean (SD) Quan-Charlson Comorbidity Index (CCI) Score, mean (SD) Baseline Individual Clinical Comorbidities (n, %)* Central Nervous System Toxicity Lipid Disorders Hypertension 13,031 14,615 16,377 741 29.1% 32.6% 36.6% 1.7% 9,825 11,482 12,883 597 28.2% 33.0% 37.0% 1.7% 3,206 3,133 3,494 144 32.1% 31.4% 35.0% 1.4% 29,162 15,602 65.1% 34.9% 23,259 11,528 66.9% 33.1% 5,903 4,074 59.2% 40.8% 10,958 7,189 16,742 8,917 958 24.5% 16.1% 37.4% 19.9% 2.1% 8,628 5,652 13,060 6,814 633 24.8% 16.2% 37.5% 19.6% 1.8% 2,330 1,537 3,682 2,103 325 23.4% 15.4% 36.9% 21.1% 3.3% 2,205 1,980 189 62 2,022 2,583 2,111 4.9% 4.4% 0.4% 0.1% 4.5% 6.0% 4.7% 1,709 1,509 37 53 1,523 1,928 1,467 4.9% 4.3% 0.1% 0.2% 4.4% 6.0% 4.2% 496 471 152 9 499 655 644 5.0% 4.7% 1.5% 0.1% 5.0% 7.0% 6.5% 40,880 3,004 91.0% 7.0% 31,859 2,269 92.0% 7.0% 9,021 735 90.0% 7.0% 966.6 (338.8) 1.4 (2.3) 957.9 (341.8) 1.4 (2.3) 996.8 (326.5) 1.4 (2.4) 11,650 5,398 9,476 26.0% 12.1% 21.2% 8,794 4,382 7,478 25.3% 12.6% 21.5% 2,856 1,016 1,998 28.6% 10.2% 20.0% ART: antiretroviral treatment, MTR: multiple-tablet regimen, STR: single-tablet regimen, SD: standard deviation, US: United States * Presented top 3 baseline individual comorbidities prevalent in at least 10% of patients on ART
Results: Persistent Outcomes At 6 months, 62% of patients on STRs were persistent, compared to 41% for MTRs (Table 3) Among all patients, persistence was highest with B/F/TAF 68% at 6 months; 44% at 12 months 9
Table 3: Mean and Median Persistence by Treatment Regimen Regimen* N Mean** Median** Patients with 6-month persistence (n, %) Patients with 12-month persistence (n, %) 34,787 STR Overall 239 282 62% 36% B/F/TAF 9,052 259 341 68% 44% DTG/ABC/3TC 7,384 239 282 62% 36% EVG/COBI/FTC/TAF 9,500 234 268 60% 34% EVG/COBI/FTC/TDF 1,569 185 152 44% 20% RPV/FTC/TAF 2,699 254 330 66% 43% RPV/FTC/TDF 1,112 202 184 50% 24% EFV/FTC/TDF 1,986 207 196 52% 27% DRV/c/r/FTC/TAF 873 237 272 62% 35% 9,977 MTR Overall 168 115 41% 22% FTC/TDF+DTG 2,122 23% 9% 107 30 FTC/TAF+DTG 5,487 207 201 52% 30% FTC/TDF+RAL 1,697 95 30 19% 8% FTC/TAF+RAL 657 233 283 60% 39% ABC: Abacavir, B: Bictegravir, COBI: Cobicistat, DRV: Darunavir, DTG: Dolutegravir, EFV: Efavirenz, EVG: Elvitegravir, F: Emtricitabine, FTC: Emtricitabine, RAL: Raltegravir, RPV: Rilpivirine, TAF: Tenofovir alafenamide fumarate, TDF: Tenofovir disoproxil fumarate, 3TC: Lamivudine * Mean and median number of days persistent assessed during 12 months follow-up ** Regimens only with sample size >=500 were assessed for persistence outcomes
Results: Persistent Outcomes Kaplan-Meier analyses demonstrated that patients on STRs had more days on therapy than those on MTRs, that is, were more persistent. STR had more days on therapy than those on MTR (Figure 2) Patients on B/F/TAF had more days on therapy than those on DTG/ABC/3TC, FTC/TDF+DTG, and FTC/TAF+DTG (Figure 3) 11
Figure 3: Treatment Persistence Among Regimens DHHS Recommended Initial Regimens for Most People with HIV ABC: Abacavir, B: Bictegravir, 3TC: Lamivudine, DHHS: Department of Health and Human Services, DTG: Dolutegravir, F: Emtricitabine, FTC: Emtricitabine, MTR: multiple-tablet regimen, STR: single-tablet regimen, TAF: Tenofovir alafenamide fumarate, TDF: Tenofovir disoproxil fumarate,
Results: Persistence Outcomes After controlling for baseline characteristics, Figure 4 shows the adjusted results: MTRs were associated with 1.71 greater risk of treatment discontinuation compared to STRs (p<0.001) When compared to B/F/TAF, the risks of treatment discontinuation based on hazard ratios were: 1.25 times higher for DTG/ABC/3TC (p<0.001) 3.75 times higher for FTC/TDF+DTG (p<0.001) 1.57 times higher for FTC/TAF+DTG (p<0.001) 14
Figure 4: Adjusted Hazard Ratio for Treatment Discontinuation ABC: Abacavir, B: Bictegravir, 3TC: Lamivudine, DTG: Dolutegravir, F: Emtricitabine, FTC: Emtricitabine, MTR: multiple-tablet regimen, STR: single-tablet regimen, TAF: Tenofovir alafenamide fumarate, TDF: Tenofovir disoproxil fumarate
Limitations This analysis focused on those covered by Medicaid insurance, and results may differ for commercial insurance populations The geographic spread of Medicaid beneficiaries in the analysis is skewed towards the South.
Conclusion Among adult US Medicaid beneficiaries living with HIV, STRs were associated with longer persistence on a first-line therapy compared to MTRs. Among adult US Medicaid beneficiaries living with HIV, B/F/TAF had the highest persistence rate compared to DTG/ABC/3TC, FTC/TDF+DTG, and FTC/TAF+DTG.
References 1. DHHS Panel on Antiretroviral Guidelines for Adults and Adolescents A Working Group of the Office of AIDS Research Advisory Council. Guidelines for the Use of Antiretroviral Agents in Adults and Adolescents with HIV. 2021. Available at: https://clinicalinfo.hiv.gov/sites/default/files/guidelines/documents/Adultand AdolescentGL.pdf
Disclosures Ishveen Chopra, Qiao Mu, Vasantha Pedarla, of StatInMed Research; Joshua Gruber, Woodie Zachry, Dylan Mezzio are employees of Gilead; Joshua Cohen is an employee of Tufts University.