Comparison of Rolling Conformity Jurisdictions Addressing 951A of the IRC (GILTI) under the TCJA
This data presents a comparison of rolling conformity jurisdictions addressing GILTI provisions under the 2017 Tax Cuts and Jobs Act. It outlines the jurisdictions coupled with provisions, including levels of GILTI incorporation. Additionally, it offers insights into projected effects on corporate income tax based on brackets. Disclaimers highlight assumptions and estimations used in the analysis.

Download Presentation

Please find below an Image/Link to download the presentation.
The content on the website is provided AS IS for your information and personal use only. It may not be sold, licensed, or shared on other websites without obtaining consent from the author. Download presentation by click this link. If you encounter any issues during the download, it is possible that the publisher has removed the file from their server.
E N D
Presentation Transcript
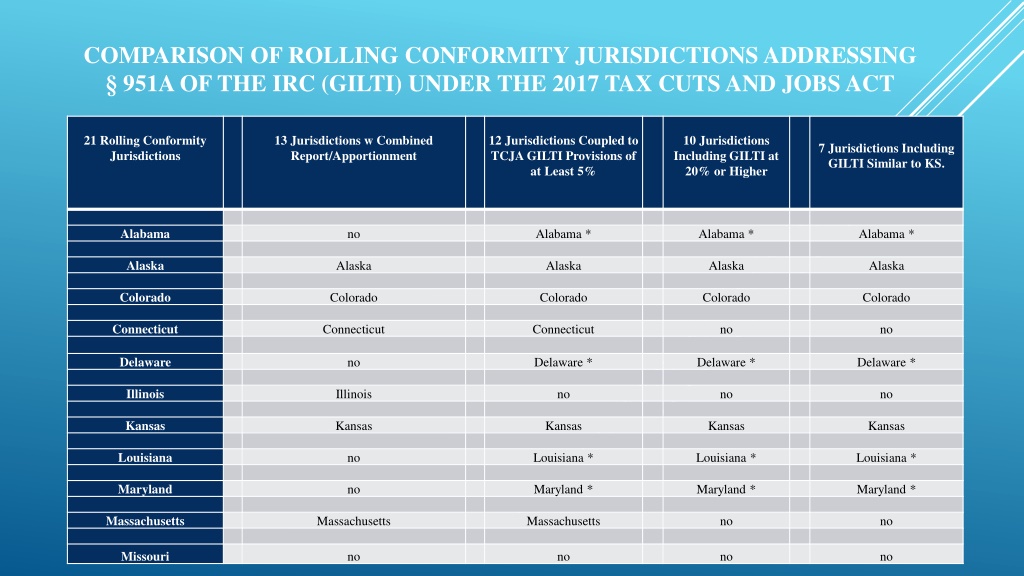
COMPARISON OF ROLLING CONFORMITY JURISDICTIONS ADDRESSING 951A OF THE IRC (GILTI) UNDER THE 2017 TAX CUTS AND JOBS ACT 21 Rolling Conformity Jurisdictions 13 Jurisdictions w Combined Report/Apportionment 12 Jurisdictions Coupled to TCJA GILTI Provisions of at Least 5% 10 Jurisdictions Including GILTI at 20% or Higher 7 Jurisdictions Including GILTI Similar to KS. Alabama no Alabama * Alabama * Alabama * Alaska Alaska Alaska Alaska Alaska Colorado Colorado Colorado Colorado Colorado Connecticut Connecticut Connecticut no no Delaware no Delaware * Delaware * Delaware * Illinois Illinois no no no Kansas Kansas Kansas Kansas Kansas Louisiana no Louisiana * Louisiana * Louisiana * Maryland no Maryland * Maryland * Maryland * Massachusetts Massachusetts Massachusetts no no Missouri no no no no
2 COMPARISON OF ROLLING CONFORMITY JURISDICTIONS ADDRESSING 951A OF THE IRC (GILTI) UNDER THE 2017 TAX CUTS AND JOBS ACT 21 Rolling Conformity Jurisdictions 13 Jurisdictions w Combined Report/Apportionment 12 Jurisdictions Coupled to TCJA GILTI Provisions of at Least 5% 10 Jurisdictions Including GILTI at 20% or Higher 7 Jurisdictions Including GILTI Similar to KS Montana Montana Montana Montana no Nebraska Nebraska Nebraska Nebraska Nebraska New Mexico no no no no New York New York New York no no North Dakota North Dakota North Dakota North Dakota no Oklahoma no no no no COMPARISON OF ROLLING CONFORMITY JURISDICTIONS ADDRESSING 951A OF THE IRC (GILTI) UNDER THE 2017 TAX CUTS AND JOBS ACT CONT D Utah Utah Rhode Island Rhode Island Rhode Island Rhode Island Rhode Island Tennessee no no no no Utah Utah Utah D. C. D. C. D. C. D. C. D. C. * Despite not being a combined report state, these states are including GILTI in their respective tax bases, but they are not included in the total count for this Table.
PROJECTED EFFECT OF GILTI ON CORPORATE INCOME TAX BY BRACKET - DISCLAIMERS - The following Tables are based on fairly large assumptions: 3 The GILTI provisions under the Tax Cut & Jobs Act became effective for TY 2018, and those returns are just now coming due. The data is based on an average for 2015 - 17 tax returns. This assumes that TY 2018, 19, etc. will be, more or less, the same. There is no assurance that will be the case. To create this worksheet, we assumed that the projected GILTI dollars are the same as those set out in the fiscal note to SB 22 that was vetoed last session. Those numbers were estimated based on the federal Joint Committee on Taxation s 2017 projections/estimates for the Tax Cut & Jobs Act. So, the fiscal numbers (and these Tables) are estimates based on an even larger estimate. This is not ideal for revenue estimating (or creating a hypothetical Table). While taxable income may have increased over the past two years, many factors may have contributed to the increase. Perhaps it is tied to increased dollars based on GILTI, perhaps it is tied to increased corporate profits due to a pretty torrid economy right now, it may be tied to a reduction in NOLs, deductions, credits, etc., or a combination of any or all of these.
4 PROJECTED EFFECT OF GILTI ON CORPORATE INCOME TAX BY BRACKET DISCLAIMERS CONT D Estimating the effect of GILTI is not precise. For example, there is no real neat, uniform set of boxes for apportionment factors that we can readily project. Some corporations may be wholly in Kansas, others may have limited activity in Kansas, some corporations may outsource a lot of their labor, while others may have a heavy property presence in Kansas. No one corporation is going to have the same factors as another company. Even within the same industry (e.g. agriculture technology/communications, etc.), you cannot really compare one corporation to another to project. Therefore, the following Tables are based solely on various taxable income strata. They closely parallel the strata that KDR uses in its annual report. There is no clear, satisfactory way to allocate within each strata the projected/estimated $25.6M increase in revenues based on GILTI dollars under current Kansas law. While not perfect, these Tables are based on the assumption that the GILTI related dollars would fall due in the same ratio as the percentages paid on non-GILTI dollars. In other words, if companies in a given strata have paid 5% of corporate taxes in non-GILTI dollars in prior year, it was assumed they would also pay 5% of GILTI related dollars.
5 PROJECTED EFFECT OF GILTI ON CORPORATE INCOME TAX BY BRACKET DISCLAIMERS CONT D But wait there s more Last, you will note that the clear majority (more than half) of corporate filers have no taxable income. These companies may have had sufficient depreciation to off-set income, or NOLs, or credits, or they may have just had a bad year. But, for one reason or another, they had no taxable income. Yet, you cannot just assume these are small guys with no foreign sourced revenues. A three year average in this strata reflects ($3,230,000,000) billion dollars in taxable income. You will see that this is nearly 79% as high as the highest Group with taxable income of $4,100,000,000 billion dollars. So, these may be quite large companies with a large foreign presence that generates substantial 951AGILTI dollars. That said, there is just no way at this point in time to allocate any of the projected/estimated $25.6M GILTI dollars to this group. So, all of the GILTI dollars in these Tables are only allocated to those strata that had some taxable income. KDR knows this is an incorrect assumption, but there is no other clear method to allocate them differently at this time.
6 THREE YEAR AVERAGE OF CORPORATE INCOME TAX LIABILITY BY BRACKET FOR TAX YEARS 2015-17 Taxable Income Strata at 7% Tax Rate Three Year Average of Number of Filers Three Year Average Kansas Taxable Income Three Year Average Tax Liability After Apportionment Three year Average % of Total Liability Average Tax Liability Per Taxpayer Group 1 No Taxable Income 16,000 ($3,253,337,000) $0 0% $0 Group 2 $0 - $75K (Effective Tax Rate 2.54%) 7,900 $141,145,000 $6,129,000 1.7% $776 Group 3 $75K - $100K (Effective Tax Rate 3.72%) 475 $41,212,000 $2,070,000 0.6% $4,358 Group 4 $100K - $500K (Effective Tax Rate 4.76%) 1,400 $304,154,000 $18,162,000 5.0% $12,973 Group 5 $500K - $1M (Effective Tax Rate 5.35%) 290 $207,702,000 $13,271,000 3.6% $45,762
7 THREE YEAR AVERAGE OF CORPORATE INCOME TAX LIABILITY BY BRACKET FOR TAX YEARS 2015-17 Taxable Income Strata at 7% Tax Rate Three Year Average of Number of Filers Three Year Average Kansas Taxable Income Three Year Average Tax Liability After Apportionment Three year Average % of Total Liability Average Tax Liability Per Taxpayer Group 6 $1M - $5M (Effective Tax Rate 5.41%) 440 $953,854,000 $62,004,000 16.9% $140,918 Group 7 $5M - $10M (Effective Tax Rate 5.86%) 95 $660,426,000 $42,561,000 11.6% $448,011 Group 8 Greater than $10M (Effective Tax Rate 5.87%) 109 $4,111,297,000 $222,435,000 60.7% $2,040,688 TOTALS (Effective Tax Rate 5.56%) 26,709 $6,419,790,000 $366,632,000 100% $2,693,485
8 PROJECTED CORPORATE INCOME TAX LIABILITY WITH INCLUSION OF $25.6M OF 951A INCOME (GILTI) BY BRACKET Average Difference Pre- GILTI and Post- GILTI Liability per Taxpayer Taxable Income Strata at 7% Tax Rate Average Number of Filers Average Kansas Taxable Income Average Tax Liability After Apportionment Average % of Total Liability Projected Tax Liability After Apportionment w Inclusion of $25.6M GILTI Weighted by Total Liability % Average Difference Pre-GILTI and Post- GILTI Group 1 No Taxable Income Effective Tax Rate 2.54% 16,000 ($3,253,337,000) n/a 0% $0 $0 $0 Group 2 $0 - $75K Effective Tax Rate 3.72% 7,900 $141,145,000 $6,129,000 1.7% $6,556,956 $427,956 $54 Group 3 $75K - $100K Effective Tax Rate 4.76% 475 $41,212,000 $2,070,000 0.6% $2,085,360 $15,360 $32 Group 4 $100K - $500K Effective Tax Rate 5.35% 1,400 $304,154,000 $18,162,000 5.0% $19,442,000 $1,280,000 $914 Group 5 $500K - $1M Effective Tax Rate 5.41% 290 $207,702,000 $13,271,000 3.6% $14,197,645 $926,645 $3,195
9 PROJECTED CORPORATE INCOME TAX LIABILITY WITH INCLUSION OF $25.6M OF 951A INCOME (GILTI) BY BRACKET Taxable Income Strata at 7% Tax Rate Average Number of Filers Average Kansas Taxable Income Average Tax Liability After Apportionment Average % of Total Liability Projected Tax Liability After Apportionment w Inclusion of $25.6M GILTI Weighted by Total Liability % Average Difference Pre-GILTI and Post- GILTI Average Difference Pre-GILTI and Post-GILTI Liability per Taxpayer Group 6 $1M - $5M Effective Tax Rate 5.41% 440 $953,854,000 $62,004,000 16.9% $66,333,416 $4,329,416 $9,840 Group 7 $5M - $10M Effective Tax Rate Effective Tax Rate 5.86% 95 $660,426,000 $42,561,000 11.6% $45,532,813 $2,971,813 $31,282 Group 8 Greater than $10M Effective Tax Rate 5.87% 109 $4,111,297,000 $222,435,000 60.7% $237,966,476 $15,531,476 $142,491 TOTALS Effective Tax Rate 5.56% 26,709 $6,419,790,000 $366,632,000 100% $392,114,665 $25,482,665 $187,809