Improving Customer Service: Challenges and Strategies in 2024
Despite rising customer demands and declining staffing levels, efforts are underway to enhance customer service in SSA. Challenges include administrative funding constraints, increased retiree numbers, and staff attrition. Strategies involve leadership changes, increased onsite presence, and performance management initiatives like SecuritySTAT. Comparisons with private insurers highlight SSA's efficiency in administrative expenses. Initiatives aimed at driving change and leading from the front lines are being implemented to address the customer service crisis.

Download Presentation

Please find below an Image/Link to download the presentation.
The content on the website is provided AS IS for your information and personal use only. It may not be sold, licensed, or shared on other websites without obtaining consent from the author. Download presentation by click this link. If you encounter any issues during the download, it is possible that the publisher has removed the file from their server.
E N D
Presentation Transcript
A Path to Improve Customer Service May 2024
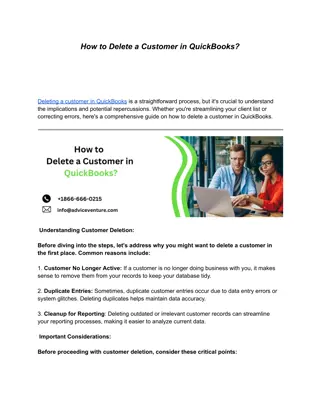
Overall Average Wait Time By State for SSA Initial Disability Decisions Overall Average Wait Time 224 137 291 172 137 144 133 234 361 221 240 State/Territory NH VT MA CT RI NJ PR DE MD DC HI 2 * Average wait times in days; updated as of Friday, May 31, 2024 ** Map color gradation is based on SSA s historical overall average wait time of 120 days for initial disability claims Data Source: Social Security Administration
Staffing Declines as Beneficiaries Rise 85 DI Beneficiaries Staffing On-Duty OASI Beneficiaries SSI Recipients 80 66,967 68,000 75 Agency Full-Time Permanent Employees 70 63,064 62,948 Beneficiaries and Recipients (excludes State DDS staff) 65 62,000 59,293 (in millions) 60 59,623 59,276 55 56,894 50 56,000 56,423 Lowest Staffing in 25 Years 45 40 50,000 35 FY FY FY FY FY FY FY FY FY FY FY FY FY FY FY FY FY FY FY FY FY FY FY FY FY FY 1999 2000 2001 2002 2003 2004 2005 2006 2007 2008 2009 2010 2011 2012 2013 2014 2015 2016 2017 2018 2019 2020 2021 2022 2023 2024 EST 3 Field Office Attrition 10% 1-800 Staff Attrition 22%
Administrative Funding Declining as % of Benefit Outlays SSA Limitation on Administrative Expense (LAE) as a Percent of Benefit Outlays 1.40% $1,600,000 1.26% 1.26% 1.26% 1.25% 1.18% $1,400,000 1.13% 1.20% 1.09% 1.05% Beneficiaries are rising. 12,000 more retirees each week record high. Staffing levels are declining to lowest level in 27 years. This has resulted in a customer service crisis and declines in our performance. 1.01% $1,200,000 Benefit Payment Outlays (in millions) 0.95% 1.00% LAE (percent of benefit outlays) $1,000,000 0.80% $800,000 0.60% $600,000 0.40% $400,000 0.20% $200,000 0.00% $- FY 15 Actual FY 16 Actual FY 17 Actual Benefit Payment Outlays FY 18 Actual FY 19 Actual FY 20 Actual FY 21 Actual Actual percent of LAE to Benefit Payments FY 22 Actual FY 23 Actual FY 24 Enacted 4
We are still far more efficient than private insurance companies in admin expenses Liberty Mutual Allstate SSA 23.6% 25.0% 19.4% 20.0% 15.0% 10.0% 5.0% 1.2% 0.0% Liberty Mutual Allstate SSA 5
Driving Change, Leading from the Front Lines Announced a plan to increase our onsite presence beginning in April. Hired new Chief Operating Officer, Chief Information Officer, and General Counsel. Conducted 10 town halls throughout the country; over 2,000 employees present. Launched SecuritySTAT on February 5 a cross-cutting performance management program to accelerate the deployment of a host of customer service improvements. 6
The Presidents Budget Improves Customer Service 85 DI Beneficiaries Staffing On-Duty OASI Beneficiaries SSI Recipients 80 68,000 66,967 75 Agency Full-Time Permanent Employees 70 63,064 62,948 Beneficiaries and Recipients (excludes State DDS staff) 65 62,000 59,293 60,097 (in millions) 60 59,623 59,276 55 Lowest Staffing in 25 Years 56,42356,894 50 56,000 45 40 50,000 35 FY FY FY FY FY FY FY FY FY FY FY FY FY FY FY FY FY FY FY FY FY FY FY FY FY FY FY FY FY FY FY 1999 2000 2001 2002 2003 2004 2005 Field Office Attrition 10% 1-800 Staff Attrition 22% *Estimate consistent with the FY 2025 President s Budget Request 2006 2007 2008 2009 2010 2011 2012 2013 2014 2015 2016 2017 2018 2019 2020 2021 2022 2023 2024 EST 2025 EST* 2026 EST 2027 EST 2028 EST 2029 EST 7