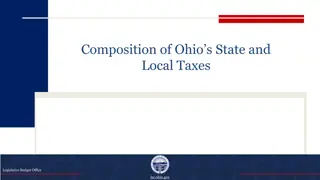
Addressing Local Wealth Disparities in Ohio's School Funding
School districts in Ohio experience significant variations in property values, affecting their ability to generate local revenue. The state's school funding formula aims to neutralize the impact of local property wealth on educational opportunities by providing more aid to lower-wealth districts. This includes distributing state foundation aid based on district wealth quintiles and offering targeted assistance for specific student needs. The funding formula helps ensure more equitable operating revenues across districts.

Download Presentation

Please find below an Image/Link to download the presentation.
The content on the website is provided AS IS for your information and personal use only. It may not be sold, licensed, or shared on other websites without obtaining consent from the author. Download presentation by click this link. If you encounter any issues during the download, it is possible that the publisher has removed the file from their server.
E N D
Presentation Transcript
Local Wealth Disparities and State Foundation Aid Legislative Budget Office lsc.ohio.gov lsc.ohio.gov
School district property values vary widely across Ohio Due to uneven distribution of taxable property, value per pupil varies widely across school districts: Lowest wealth (quintile 1) average $108,000 per pupil Highest wealth (quintile 5) average $300,000 per pupil This variation impacts a district s ability to raise local revenue. A 20-mill (2%) property tax levy generates: An average $2,160 per pupil for districts in quintile 1 An average $6,000 per pupil for districts in quintile 5 Local property taxes represent about 96% of school district local revenues, meaning that per-pupil valuation (i.e., district property wealth) indicates each district s capacity to raise local revenue. A major goal of the state s school funding formula is to neutralize the effect of local property wealth on access to basic educational opportunities. To achieve this goal, the current formula determines a per-pupil local contribution based on a mix of property value and income measures, then requires the state to make up the difference to bring the total up to a per pupil base cost amount that varies by district. Average Per-Pupil Valuation by Wealth Quintile, FY 2022 $350,000 $300,029 $300,000 $250,000 State Average, $192,587 $217,564 $184,933 $200,000 $150,519 $150,000 $108,391 $100,000 $50,000 $0 1 2 3 4 5 Quintile Ranked by Wealth (Lowest to Highest) Sources: Ohio Department of Taxation; Ohio Department of Education Note: To create the quintiles used on this and the following three slides, school districts are first ranked from lowest to highest in property value per pupil. They are then divided into five groups, each of which contains about 20% of the statewide traditional district student population. Districts in quintile 1 have the lowest property wealth and districts in quintile 5 have the highest property wealth. lsc.ohio.gov lsc.ohio.gov Legislative Budget Office
School funding formula distributes more state aid to lower wealth districts In general, lower wealth districts receive more state foundation aid per pupil than higher wealth districts. For FY 2022, the least wealthy districts averaged $8,628 per pupil. The wealthiest districts averaged $2,643 per pupil, or about 30% of what the lowest-wealth districts received. The funding formula allocates most (58.6% of total) state aid through the state share of the base cost, which supports the cost of regular education and varies based on local capacity. Targeted assistance (15.6%) generally provides additional funds to districts with low per-pupil or total wealth. Categorical add-ons (16.0%) support: Special education (8.9%) Economically disadvantaged students (4.9%) Gifted student programs (1.0%) Career-technical education (0.7%) English learners (0.4%) Transportation aid (7.2%) is based on mileage and the number of students transported. Funding guarantees ensure a district s state aid does not fall below certain historical funding levels. Per-Pupil Foundation Aid by Wealth Quintile, FY 2022 $10,000 Funding Guarantees Transportation Categorical Add-ons Targeted Assistance State Share of Base Cost $8,628 $9,000 $8,000 $7,000 $6,356 $6,000 $5,000 $4,319 $4,000 $2,934 $2,643 $3,000 $2,000 $1,000 $0 1 2 3 4 5 Quintile Ranked by Wealth (Lowest to Highest) Source: Ohio Department of Education lsc.ohio.gov lsc.ohio.gov Legislative Budget Office
State foundation aid helps equalize per-pupil operating revenues Lower wealth districts tend to have lower per-pupil local tax revenues. State foundation aid helps equalize operating revenues between school districts with less local tax revenue and those with more. The wealthiest districts, however, still have more resources. Tax revenues depend on a district s wealth and taxpayers willingness and ability to approve tax levies. Ohio does not limit the amount of taxes local voters may approve for their schools. In FY 2022, eight districts raised over $20,000 per pupil from local taxes. By contrast, six districts raised less than $2,000 per pupil. Tax Revenue and State Foundation Aid Per Pupil by Wealth Quintile, FY 2022 $16,000 $14,859 $13,192 $14,000 $12,533 $12,273 $2,643 $11,991 $12,000 $2,934 $10,000 $4,319 $6,356 $8,628 $8,000 $12,216 $6,000 $9,598 $4,000 $7,671 State Foundation Aid Equalization of Operating Revenues, FY 2022 $5,917 $4,564 $2,000 % of Revenue from State Aid % of Revenue from Local Taxes Total Revenue as % of Quintile 5 Quintile $0 1 2 3 4 5 1 65.4% 34.6% 88.8% Quintile Ranked by Wealth (Lowest to Highest) 2 51.8% 48.2% 82.6% Tax Revenue State Foundation Aid 3 36.0% 64.0% 80.7% Sources: Ohio Department of Education; Ohio Department of Taxation 4 23.4% 76.6% 84.3% Note: In the chart, tax revenue includes locally paid property taxes, school district income taxes, and certain state-paid property tax rollbacks and reimbursements. 5 17.8% 82.2% 100% lsc.ohio.gov lsc.ohio.gov Legislative Budget Office
Interdistrict equity improved since FY 1991 Average Quintile Revenue Per Pupil as a Percentage of Quintile 5 Since FY 1991, average revenue per pupil in the lower wealth quintiles generally moved closer to that of districts in the highest wealth quintile. The biggest changes came in the two lowest wealth quintiles: FY 1991 FY 2021 100% 90% 80% 70% 60% 50% Quintile 1: +28 percentage points 100% 100% 98% 92% 91% 89% 88% 82% Quintile 2: +18 percentage points District financial resources depend less on district wealth than in 1991: 40% 73% 70% 30% 20% Variation in per-pupil revenue explained by per-pupil property value: 10% 0% 1 2 3 4 5 FY 1991: 76% Quintile Ranked by Wealth (Lowest to Highest) FY 2021: 20% Source: Ohio Department of Education. Revenue includes traditional school district operating revenue from all sources as reported by districts. lsc.ohio.gov lsc.ohio.gov Legislative Budget Office