Descriptive Statistics and Data Visualization in Statistical Analysis
Explore a variety of statistical concepts including stemplots, histograms, measures of center and spread, and identifying distributions in data sets. Learn to analyze and interpret data through different graphical representations and numerical summaries. Dive into the world of statistics with engaging exercises and real-life scenarios to enhance your statistical literacy.
Download Presentation

Please find below an Image/Link to download the presentation.
The content on the website is provided AS IS for your information and personal use only. It may not be sold, licensed, or shared on other websites without obtaining consent from the author.If you encounter any issues during the download, it is possible that the publisher has removed the file from their server.
You are allowed to download the files provided on this website for personal or commercial use, subject to the condition that they are used lawfully. All files are the property of their respective owners.
The content on the website is provided AS IS for your information and personal use only. It may not be sold, licensed, or shared on other websites without obtaining consent from the author.
E N D
Presentation Transcript
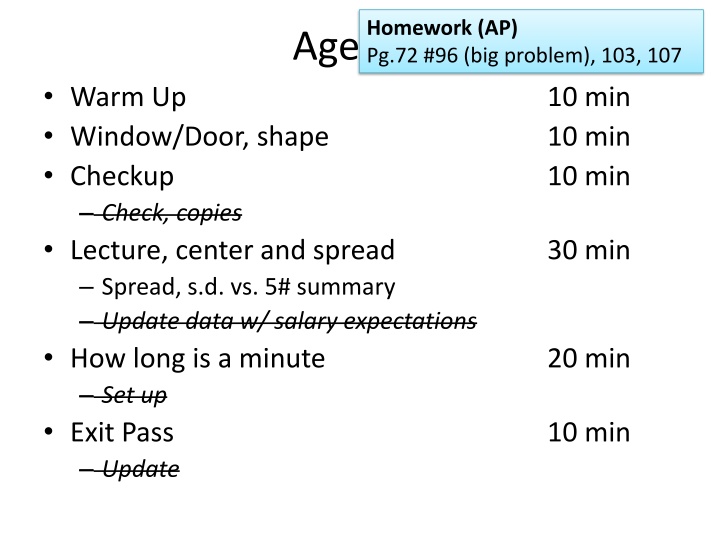
Homework (AP) Pg.72 #96 (big problem), 103, 107 Agenda Warm Up Window/Door, shape Checkup Check, copies Lecture, center and spread Spread, s.d. vs. 5# summary Update data w/ salary expectations How long is a minute Set up Exit Pass Update 10 min 10 min 10 min 30 min 20 min 10 min
Sign up for our Remind: Text to 81010, message: @602stat19 Warm Up 5. Which of the following are true statements? I. Stemplots are useful both for quantitative and categorical data sets. II. Stemplots are equally useful for small and very large data sets. III. Stemplots can show symmetry, gaps, clusters, and outliers. A) I only B) II only C) III only D) I and II E) I and III 9. If 10 executives have salaries of $80,000, 6 have salaries of $75,000, and 3 have salaries of $70,000, what is the median salary? A) $75,000 B) $76,842 C )$77,500 D) $80,000 E) none of these 35. Which of the following statements are true? I. Two students working with the same data may come up with histograms that look different. II. Displaying outliers is less problematic when using histograms than when using stemplots. III. Histograms are more widely used than stemplots or dotplots because histograms display the values of individual observations. A.) I only B.) II only C.) III only D.) I and II E.) II and III
Back-to-School night 5:30-6:15 6:15-6:25 6:30-6:40 6:50-7:00 7:10-7:20 7:30-7:40 Music/food/shopping AFROTC Flag Presentation Period 1 Period 2 Period 3 Period 4
Window/Door Whats the Shape? Consider the following variables on which you could gather data from students at RCHS. For each, describe the shape of the distribution. Skewed right/left, or symmetric? Justify. 1. EXAMPLE: Number of pairs of shoes owned 2. Number of siblings 3. Price paid for most recent haircut 4. Number of T-shirts owned 5. Distance from place of birth 6. Age 7. Amount paid on the student s last visit to a grocery store 8. Last digits of cell phone number 9. Duration of most recent phone conversation
Describing Distributions with Numbers SOCS Center and Spread
0 0 0 Measures of Center 0.75 1 2 2 2 2.5 2.5 3 Mean 4.761 hours Only when data is ~symmetric! vs. Median 3.5 hours 4 4 4 5 5 10 10 10 10 10 17
Poverty Thresholds for 2016 Related children under 18 years 0 1 2 3 4 5 6 7 8+ Size of family unit One person Two people Three people 12,331 15,871 16,337 18,540 19,078 19,096 Four people 24,447 24,847 24,036 24,120 Five people 29,482 29,911 28,995 28,286 27,853 Six people 33,909 34,044 33,342 32,670 31,670 31,078 Seven people 39,017 39,260 38,421 37,835 36,745 35,473 34,077 Eight people Nine people or more 43,637 44,023 43,230 42,536 41,551 40,300 38,999 38,668 52,493 52,747 52,046 51,457 50,490 49,159 47,956 47,658 45,822 Source: U.S. Census Bureau.
Period 1 $3,000 $12,500 $20,000 $35,182 $37,000 $40,000 $48,000 $50,000 $50,000 $50,000 $52,500 $53,000 $55,000 Salary expectations (P.1) How much do you expect to make for your annual salary in your first year of full-time employment? 1. Calculate the mean and median. $60,000 $65,000 $65,000 $65,000 $75,000 $75,000 $75,000 $80,000 $80,000 $80,000 $90,000 $120,000 $200,000 2. Suppose a new student expects to earn $1 billion(!) as the leader of a world-wide empire. Which is affected more, the mean or median? 3. Not including the new student, suppose all your estimates are increased by $5000. How might this affect the mean and median?
Period 1 $3,000 $12,500 $20,000 $35,182 $37,000 $40,000 $48,000 $50,000 $50,000 $50,000 $52,500 $53,000 $55,000 Everything is on the calculator! Type data into List at STAT 1:Edit $60,000 $65,000 $65,000 $65,000 $75,000 $75,000 $75,000 $80,000 $80,000 $80,000 $90,000 $120,000 $200,000
Period 1 $3,000 $12,500 $20,000 $35,182 $37,000 $40,000 $48,000 $50,000 $50,000 $50,000 $52,500 $53,000 $55,000 Everything is on the calculator! Type data into List at STAT 1:Edit Numerical summary Mean, standard deviation, 5# summary . STAT CALC 1:1-Var Stats $60,000 $65,000 $65,000 $65,000 $75,000 $75,000 $75,000 $80,000 $80,000 $80,000 $90,000 $120,000 $200,000
Period 3 $269 $15,000 $20,000 $20,000 $35,000 $50,000 $50,000 $50,000 $50,000 $60,000 $60,000 $65,000 $65,000 $65,000 $70,000 Salary expectations (P.2) How much do you expect to make for your annual salary in your first year of full-time employment? $70,000 $75,000 $80,000 $80,000 $80,000 $80,000 $80,000 $85,000 $88,000 $90,000 $90,000 $93,000 $100,000 $128,000 $400,000 1. Calculate the mean and median. 2. Suppose a new student expects to earn $1 billion(!) as the leader of a world-wide empire. Which is affected more, the mean or median? 3. Not including the new student, suppose all your estimates are increased by $5000. How might this affect the mean and median?
Period 3 $269 $15,000 $20,000 $20,000 $35,000 $50,000 $50,000 $50,000 $50,000 $60,000 $60,000 $65,000 $65,000 $65,000 $70,000 Everything is on the calculator! Type data into List at STAT 1:Edit $70,000 $75,000 $80,000 $80,000 $80,000 $80,000 $80,000 $85,000 $88,000 $90,000 $90,000 $93,000 $100,000 $128,000 $400,000
Period 3 $269 $15,000 $20,000 $20,000 $35,000 $50,000 $50,000 $50,000 $50,000 $60,000 $60,000 $65,000 $65,000 $65,000 $70,000 Everything is on the calculator! Type data into List at STAT 1:Edit Numerical summary Mean, standard deviation, 5# summary . STAT CALC 1:1-Var Stats $70,000 $75,000 $80,000 $80,000 $80,000 $80,000 $80,000 $85,000 $88,000 $90,000 $90,000 $93,000 $100,000 $128,000 $400,000
1 of 3 Notes n = 30n = 28 5-number summary P.2 0 0 0 0 0 0 0 0 0 1 1 1 2 2 2 Minimum First quartile (25th percentile) Median Third quartile (75th percentile) Maximum 2 2 2 2 3 3 3 3 3 Interquartile range Min 0 0 3.5 4 5 5 8 9 Q1 0 0 1.5 x IQR Rule for Outliers An observation is an outlier if it falls more than (1.5xIQR) above Q3 or below Q1. Q1 (1.5xIQR) Q3 + (1.5xIQR) Med 2 2 Q3 3 3 Max 9 5
Window/Door Identify any outliers in the data sets: 1. 0, 3, 8, 13, 19, 40 No outliers, 19+24=43 2. 0, 3, 8, 13, 19, 44 44 is outlier, 19+24=43 No outliers, 35+45=80 3. 0, 5, 15, 25, 35, 75 4. -15, -15, -7, 0, 35, 100, 120, 150, 355 355 is an outliers, 135+219=354
2 of 3 Notes Standard Deviation P.2 0 0 0 0 0 0 0 0 0 1 1 1 2 2 2 2 2 2 2 3 3 3 3 3 Average distance from mean. Average of the squares of the deviations from the mean Only use when the mean is chosen as the measure of center Sensitive to outliers 2.25 3.5 4 5 5 8 9 or 1.54
3 of 3 P.2 0 0 0 0 0 0 0 0 0 1 1 1 2 2 2 Notes Boxplot 2 2 2 2 3 3 3 3 3 Represent 5-number summary on # line Modified boxplot = outliers shown Min 0 0 Q1 0 0 Med 2 2 Q3 3 3 3.5 4 5 5 8 9 Max 9 5 0 1 2 3 4 5 6 7 8 9 10 11
Period 1 $3,000 $12,500 $20,000 $35,182 $37,000 $40,000 $48,000 $50,000 $50,000 $50,000 $52,500 $53,000 $55,000 Everything is on the calculator! Type data into List at STAT 1:Edit Numerical summary Mean, standard deviation, 5# summary . STAT CALC 1:1-Var Stats Histograms and boxplots 2nd STAT PLOT Enter (Turn Plot ON) Histogram is graph type #3 Modified boxplot (shows outliers) is graph type #4 Boxplot is graph type #5 Can t see graph? Try ZOOM 9:ZoomStat $60,000 $65,000 $65,000 $65,000 $75,000 $75,000 $75,000 $80,000 $80,000 $80,000 $90,000 $120,000 $200,000
Period 3 $269 $15,000 $20,000 $20,000 $35,000 $50,000 $50,000 $50,000 $50,000 $60,000 $60,000 $65,000 $65,000 $65,000 $70,000 Everything is on the calculator! Type data into List at STAT 1:Edit Numerical summary Mean, standard deviation, 5# summary . STAT CALC 1:1-Var Stats Histograms and boxplots 2nd STAT PLOT Enter (Turn Plot ON) Histogram is graph type #3 Modified boxplot (shows outliers) is graph type #4 Boxplot is graph type #5 Can t see graph? Try ZOOM 9:ZoomStat $70,000 $75,000 $80,000 $80,000 $80,000 $80,000 $80,000 $85,000 $88,000 $90,000 $90,000 $93,000 $100,000 $128,000 $400,000
How long is a minute? You and your partner will need 1 watch/timer Door Tell Window to start counting 1 minute Window When you think it s been a minute, say Stop quietly. Door Write down time in seconds Do NOT tell partner how much time passed Two trials, then switch roles. Do not reveal your data to anyone else, including your partner.
How long is a minute? Give me your estimates. In L1, enter the first estimates of the class: 1. Both partners. Use your calculator to make a modified boxplot of the class first estimates. Compare calculators. 2. Both partners. Use your calculator to make a histogram. Compare calculators. 3. DOOR. Describe the distribution to your partner. In L2, enter the averages of the class: 1. Both partners. Use your calculator to make 2 simultaneous modified boxplots of both the first estimates and average estimates. Compare calculators. 2. Both partners. Use your calculator to 2 simultaneous histograms of both the first estimates and average estimates. . Compare calculators. 3. WINDOW. Compare these two distributions.
How long is a minute? I will ask you to read all three of your own estimates. Using the first estimates of the class: 1. Both partners. Use your calculator to make a modified boxplotof the class first estimates. Compare your calculators. 2. DOOR. Describe the distribution to your partner. Using the averages of the class: 1. Both partners. Use your calculator to make a histogram of the class average estimates. Compare your calculators. 2. WINDOW. Describe the distribution to your partner.
Period 1 $3,000 $12,500 $20,000 $35,182 $37,000 $40,000 $48,000 $50,000 $50,000 $50,000 $52,500 $53,000 $55,000 Exit Pass (P.1) 1. Create a 5-number summary of the data. 2. Sketch a modified boxplot of the data. $60,000 $65,000 $65,000 $65,000 $75,000 $75,000 $75,000 $80,000 $80,000 $80,000 $90,000 $120,000 $200,000 Homework (AP) Pg.72 #96 (big problem), 99, 103, 107
Period 3 $269 $15,000 $20,000 $20,000 $35,000 $50,000 $50,000 $50,000 $50,000 $60,000 $60,000 $65,000 $65,000 $65,000 $70,000 Exit Pass (P.3) 1. Create a 5-number summary of the data. 2. Sketch a modified boxplot of the data. $70,000 $75,000 $80,000 $80,000 $80,000 $80,000 $80,000 $85,000 $88,000 $90,000 $90,000 $93,000 $100,000 $128,000 $400,000 Homework (AP) Pg.72 #96 (big problem), 99, 103, 107
