ALMA Observation of Ceres Surface Temperature
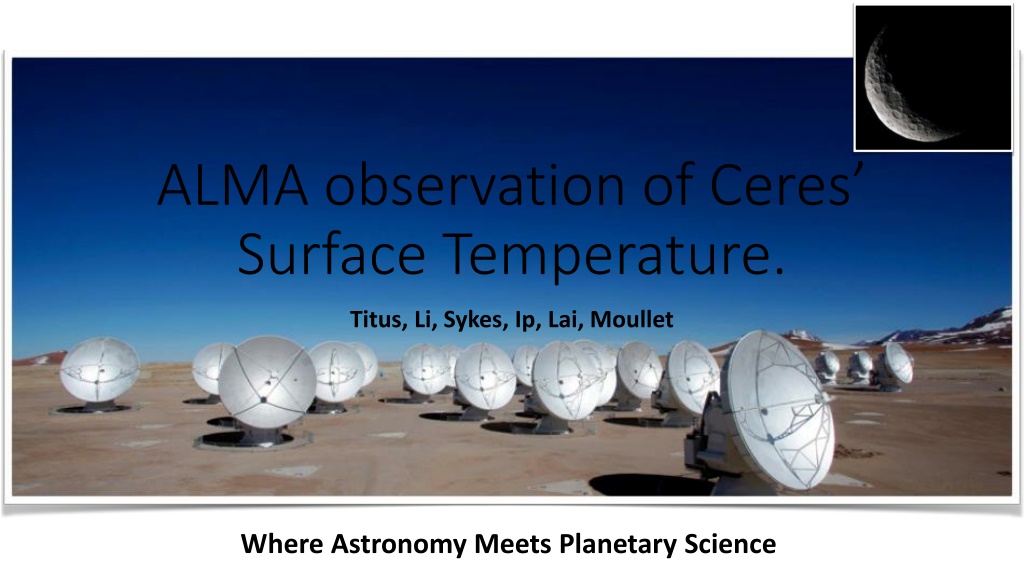
ALMA conducted ground-based observations of Ceres' surface temperature providing valuable insights for planetary science. The data processing steps involved models interpolation, radio calibration, and thermal gradient correction to produce thermal flux maps. Key objectives included detecting the edge of the ice table and providing context for Dawn spacecraft observations. The observations covered a full rotation of Ceres and aimed to calculate the annual mean temperature using thermal models.

Download Presentation

Please find below an Image/Link to download the presentation.
The content on the website is provided AS IS for your information and personal use only. It may not be sold, licensed, or shared on other websites without obtaining consent from the author. Download presentation by click this link. If you encounter any issues during the download, it is possible that the publisher has removed the file from their server.
E N D
Presentation Transcript
ALMA observation of Ceres Surface Temperature. Titus, Li, Sykes, Ip, Lai, Moullet Where Astronomy Meets Planetary Science
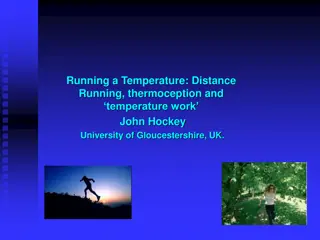
Motivation Figure from Nature Why do ground based observations when we have a spacecraft in orbit? We need to be observing Ceres long after Dawn has died. Low-spatial resolution but complete annual coverage Episodic events need to be observed. (e.g K pper et al., 2014) Insensitive to T < 180 K Precludes Early Morning or Mid/Late afternoon Observations Precludes Polar Observations Solar System Observations Principle Investigator J.-Y. Li Funded for a 5 year Mission. Original Questions Can we detect the edge of the ice table? Can we see two distinct hemispheres? Camberlain et al.,2009 Can we provide context for Dawn observations? 9/6/2017 Flagstaff Astronomy Seminar - Lowell Observatory 2
Data/Models Processing Steps Data (ALMA) Models Interpolated to Observations Radio Calibration KRC Models Map Thermal Gradient Correction; Convert to Radiance Projection Limb (IFOV) Correction Meta Data e.g. Local Time Best-Fit Parameter Maps Compare Radiance profiles 9/6/2017 Flagstaff Astronomy Seminar - Lowell Observatory 3
ALMA Observations and Processing Data Observation Dates 31 Oct 2015 2 Nov 2015 12 Nov 2015 Data Heliocentric = 2.97 au, geocentric = 2.9 - 3.1 au, phase = 19 9 hours on source of Ceres, covering one full rotation Band 6 continuum, 260 GHz (1.2 mm), 30-50 mas/beam = 60-100 km at Ceres Self-Calibration Map Projection and Meta-Data Simple Cylindrical Projection Local Time; Emission Angles 9/6/2017 Flagstaff Astronomy Seminar - Lowell Observatory 4
Thermal Models: 4 Models Thermal Gradient 9/6/2017 Flagstaff Astronomy Seminar - Lowell Observatory 7
# of Cases TI Effective Emissivity Ice Table 20 Thermal Models 4 11 0.9 (Smooth) 0.7 (Rough) 4 15 0.9 (Smooth) 0.7 (Rough) 4 21 0.9 (Smooth) 0.7 (Rough) 4 30 0.9 (Smooth) 0.7 (Rough) 4 42 0.9 (Smooth) 0.7 (Rough) N & Y Creates a Thermal Physical Unit Map Use the model results to calculate annual mean temperature. N & Y N & Y N & Y N & Y 9/6/2017 Flagstaff Astronomy Seminar - Lowell Observatory 8
Figure from Nature Questions? Questions? 9/6/2017 Flagstaff Astronomy Seminar - Lowell Observatory 9