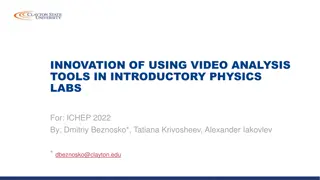
Understanding Tools and Strategies for Geometry Analysis
Explore the utilization of eLab without a detector in a university setting. Discover the significance of correct tools for geometry analysis, leveraging blessing charts and differentiated learning strategies. Learn about available files for studies such as Time of Flight, Angle of Acceptance, and more. Dive into the analysis of Angle of Acceptance and Channel Pair Separation for comprehensive insights.

Download Presentation

Please find below an Image/Link to download the presentation.
The content on the website is provided AS IS for your information and personal use only. It may not be sold, licensed, or shared on other websites without obtaining consent from the author. Download presentation by click this link. If you encounter any issues during the download, it is possible that the publisher has removed the file from their server.
E N D
Presentation Transcript
Using eLab Without a Detector NATHAN UNTERMAN UNIVERSITY OF NEW MEXICO JULY 2022
Golden Files How to find Correct Tools Geometry Blessing Charts Classroom Strategies Differentiated learning
Tools Geometry Note: If you cannot directly get the geometry of a specific file, it can be seen from the Blessing Chart for that file.
File Search The Drop Down menu has selections for DAQ and Date
Available Files Time of Flight Angle of Acceptance Shower Triangle Study Lifetime Shower Study 3.8 km Separation Speed of Muon Long Range Studies Barometric Pressure Studies
Time of Flight and Angle of Acceptance Position Channel 1 (m) Position Channel 2 (m) Position Channel 3 (m) Position Channel 4 (m) Gate (ns) Pipeline (ns) Experiment Experiment DAQ Date Geometry Coincidence Comment Angle of Acceptance Angle of Acceptance Angle of Acceptance Angle of Acceptance Angle of Acceptance Angle of Acceptance Time of Flight 6200 12.September.2019 -3 Stacked 0.04 -0.87 -1.64 -1.67 2 300 100 Barometer not reliable Time of Flight 6200 13.September.2019 Stacked 0.04 -0.87 -1.64 -1.67 2 300 100 Barometer not reliable Time of Flight 6200 14.September.2019 Stacked 0.04 -0.87 -1.64 -1.67 2 300 100 Barometer not reliable Time of Flight 6200 15.September.2019 Stacked 0.04 -0.87 -1.64 -1.67 2 300 100 Barometer not reliable Time of Flight 6200 16.September.2019 -0 Stacked 0.04 -0.87 -1.64 -1.67 2 300 100 Barometer not reliable Time of Flight 6200 16.September.2019 -1 Stacked 0.04 -0.87 -1.64 -1.67 2 300 100 Barometer not reliable
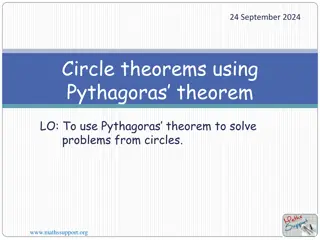
Angle of Acceptance Analysis 24-hour files only NOT corrected for pressure angle acceptance = tan-1((side/2)/(channel separation/2))*2 angle acceptance = tan-1((0.26/2)/(channel separation/2))*2 1-2 1-3 1-4 Channel pair Separation (meters) 2-3 2-4 3-4 1-2-3-4 0.824 1.68 1.71 0.856 0.859 0.03 1.71 Number of Events for (Counter Pair) Angle of Acceptance (1-3) 17.6 17.3 33.8 58231 19049 17552 57692 19070 17526 58237 19271 17744 57898 19144 17575 57688 19077 17561 55889 18888 17360 55655 18701 17276 (1-2) 35.0 (1-4) (2-3) (2-4) 33.7 (3-4) 166.8 Date DAQ 6200 6200 6200 6200 6200 6200 6200 17.3 Column E - I 80896 80208 81205 80434 81210 80395 80445 71747 71162 71745 71168 71542 71322 71582 835224 834085 837186 834965 834466 835586 835501 15189 15246 15451 15298 15201 15123 15059 2363 2280 2293 2277 2360 2237 2217 13.Sept.2019 14.Sept.2019 15.Sept.2020 17.Sept.2019 18.Sept.2019 20.Sept.2019 21.Sept.2019
Angle of Acceptance Events versus Angle of Acceptance 900000 800000 700000 600000 500000 Events 400000 300000 200000 100000 0 0 20 40 60 80 100 120 140 160 180 Angle of Acceptence
Speed of Muon 20.September.2019 Muon Speed DAQ 6200 Spacing (m) 0.91 1.68 1.71 0.77 0.8 0.03 20.Sept.2019 Counter Pair 1 2 1 - 3 1 - 4 2 - 3 2 - 4 3 - 4 1.8 x= 2.7837E+08t - 5.9393E-04 R = 9.9268E-01 1.6 Time (s) 3.52E-09 6.07E-09 6.02E-09 2.77E-09 2.75E-09 2.00E-11 v 2.78E+08 1.4 1.2 Separation (m) 1 0.8 0.6 0.4 0.2 0 0.00E+00 1.00E-09 2.00E-09 3.00E-09 4.00E-09 5.00E-09 6.00E-09 7.00E-09 Time (s)
Speed of Muon Histogram 12.September- 30.November.2019 35 30 25 Frequency 20 15 10 5 0 Speed of Muon (m/s)
Shower Triangle Study Indoor Study Time Duration All need to normalize by duration Geome try Side Length (m) Coinciden ce Experiment DAQ Date Events Comment Shower Triangle Shower Triangle Shower Triangle Shower Triangle Shower Triangle 6690 06.September.2015 14:34 Stack 0.00 38988 3 6690 04.November.2015 0:56 Array 0.50 442 3 6690 04.November.2015 12:58 Array 1.00 108 3 6690 04.November.2015 669004.November.2015 - 05.November.2015 17:00 Array 1.50 99 3 22:29 Array 2.0037+ 274 3 Crosses midnight UTC
Muon Lifetime Position Channel 1 (m) Position Channel 2 (m) Position Channel 3 (m) Position Channel 4 (m) Gate Width (seconds) Configur ation Lifetime ( S) DAQ Date Coincidence Bins Comments 6234 21.December.2017 Stacked 0.12 0.1 x 0 1 1.00E-05 40 2.1 Run under OLD program x 1.00E-05 40 2.25Run under OLD program 6234 22.December.2017 Stacked 0.12 0.1 0 1 x 1.00E-05 40 2.24Run under OLD program 6234 23.December.2017 Stacked 0.12 0.1 0 1 x 1.00E-05 40 1.99Run under OLD program 6234 24.December.2017 Stacked 0.12 0.1 0 1 x 1.00E-05 40 2.36Run under OLD program 6234 25.December.2017 Stacked 0.12 0.1 0 1 x 1.00E-05 40 2.06Run under OLD program 6234 26.December.2017 Stacked 0.12 0.1 0 1 x 1.00E-05 40 2.29Run under OLD program 6234 27.December.2017 Stacked 0.12 0.1 0 1
Frequency versus Lifetime 10 8 6 Frequency 4 2 0 Bin 1.85 1.9 1.95 2 2.05 2.1 2.15 2.2 2.25 2.3 -2 Lifetime ( S)
Shower Study 3.8 km Separation DAQ Date Configuration DAQ Date Configuration 07.February.2020 08.February.2020 09.February.2020 6200 6200 6200 07.February.2020 08.February.2020 09.February.2020 Stacked Stacked Stacked 6845 6845 6845 Stacked Stacked Stacked 6200 10.February.2020 -0 Stacked 6845 10.February.2020 -0 Stacked 6200 6200 10.February.2020 -1 11.February.2020 Stacked Stacked 6845 6845 10.February.2020 -1 11.February.2020 Stacked Stacked
Barometric Studies Any stacked file lends itself to barometric studies Days may be concatenated together under Flux study. Barometer tool will show concatenated Blessing Charts.
Classroom Strategies In most studies, enough files for individualized assignment Simple studies, such as speed of muons, taking averages More complex with histograms Outlier error analysis Differentiated Instruction possibilities Multiple sections of course can build analysis cooperatively Poster writing Reflection and metacognition of process More difficult problems, such as shower study at 3.8 km available for enrichment What else can be asked of the data set?
Other Studies Might Lunar Shadow be buried within the data set? Severe weather . . . Only limited by imagination
Contact Nathan Unterman nunterman@gmail.com 773 758-0464