Assessing Affordability and Financial Capacity for NPDES MS4 Permits
This content explores the assessment of affordability and financial capacity for implementing NPDES MS4 permits, examining indicators such as cost per household, median household income, debt indicators, and property tax revenues. It discusses EPA guidance from 1997, integrated water planning principles from 2012, and literature reviews on alternative indicators for assessing economic distress and aligning financial capacity assessments with integrated planning principles.

Download Presentation

Please find below an Image/Link to download the presentation.
The content on the website is provided AS IS for your information and personal use only. It may not be sold, licensed, or shared on other websites without obtaining consent from the author. Download presentation by click this link. If you encounter any issues during the download, it is possible that the publisher has removed the file from their server.
E N D
Presentation Transcript
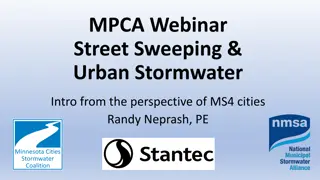
Assessing Affordability and Financial Assessing Affordability and Financial Capacity to Implement NPDES MS4 Permits Capacity to Implement NPDES MS4 Permits May 2019
EPA CSO GUIDANCE (1997) Residential indicator Cost Per Household Median Household Income Financial capacity indicator Debt indicators bond rating and overall net debt as percent of full market property value Socioeconomic unemployment rate and median household income Financial Management property tax revenue collection rate and property tax revenues as percent of full market property value
EPA INTEGRATED WATER PLANNING (2012) A voluntary process for ...identifying efficiencies in implementing requirements that arise from distinct wastewater and stormwater programs, including how best to make capital investments. Affordability is not a term used within the framework, but the eight principles include suggesting the plan [e]valuate and address community impacts and consider disproportionate burdens resulting from current approaches as well as proposed options.
LITERATURE REVIEW AWWA report (2013) - MHI is a poor indicator of economic distress; does not capture impacts across diverse populations; income levels not usually clustered around median; snapshot that does not account for the historical and future trends of a community s economic, demographic, and/or social conditions Alternative indicators income quintiles, percentage households receiving public assistance, percentage customers eligible for water affordability programs, water service delinquency rates, needs for reinvestment in infrastructure NACWA (2013) - suggests aligning the principles of integrated planning into the financial capacity assessment using three proposed elements: Water-quality based project prioritization Cash-flow forecasting Analysis of burden PENNVEST - .25% of MHI for stormwater loans
CURRENT VIEWS ON WATER AFFORDABILITY American Water Works Association: Given variations in local economic conditions, compositions of the customer base, and community values, defining affordability must be done at the local level. Is Our Water Affordable?, authors Jon Davis and Joe Crea corroborate this idea: Any one-size-fits-all guidance on what constitutes affordable water service is going to be inappropriate when applied to most local considerations. http://efc.web.unc.edu/2019/04/22/challenges-and-innovations-current-and-future-states-of-water-affordability/
MS4 Community Demographic Overview Population Estimate 2017 Median Household Income (2017 dollars) 2011- 2015 Persons in Poverty, percent Persons 65 years and over, percent Households, 2013-2017 MS4 Permittee Anne Arundel County 573,235 $94,502 6.10% 14.40% 205,395 Baltimore County 832,468 City of Baltimore 611,648 Montgomery County $71,810 $46,641 $103,178 8.30% 22.40% 7.00% 16.80% 12.80% 14.90% 312,859 239,791 369,242 1,058,810 Prince George's County 912,756 $78,607 8.60% 12.80% 306,694 Source: U.S. Census Bureau QuickFacts - Population estimates, July 1, 2018, (V2018). Retreived from https://www.census.gov/quickfacts/fact/table/annearundelcountymaryland,baltimorecountymaryland,baltimoreci tymaryland,montgomerycountymaryland,princegeorgescountymaryland/PST045218
COMPONENTS OF A STORMWATER PROGRAM Capital Projects Operations and Maintenance Public Education and Involvement Technical Support Engineering and Planning Regulation and Enforcement Administration Billing and Finance
STORMWATER SYSTEMS County Miles of stormwater pipes No. Of inlets Land area (sq miles) Anne Arundel 990 37,000 415 1450 51,370 598 Baltimore County City of Baltimore Montgomery County 1100 53,000 81 1100 38,000 491 65,195 (inlets, manhole, outfalls) 483 Prince George s County
THEMES FROM PERMITTEE MEETINGS Fiscal process and allocation are not the only barriers to meeting MS4 permit requirements. The focus on local TMDLs is important for stakeholders and appropriations moving forward. Certainty about pollution reduction credits would help with forecasting costs. Operations and maintenance needs are a looming financial issue and not yet fully accounted for in budgets. The need for a comprehensive analysis of water service budgets and capacity is apparent with various departments doing work that could or should count toward watershed restoration as a whole.
SUMMARY Current cost information is not comprehensive of full stormwater system. Operation and maintenance will be an increasing share of stormwater budgets over time. Each permittee is in a slightly different situation regarding provision of water services (drinking, waste, storm) so no true apples-to- apples comparison. A need to benchmark. A need for other indicators/parameters. This is a beginning.
AFFORDABILITY $$$$ https://www.amazon.com/Life-Journey-Not- Destination-Happiness-ebook/dp/B0792X2ZTG
AFFORDABILITY The EFC researched existing water service affordability literature, including relevant Environmental Protection Agency (EPA) documents, and developed a draft matrix including three considerations: Household Cost as a percent of: Median Household Income Low-Income Brackets Key Socioeconomic Parameters Financial Capability Indicators 12
MAPPING FINANCIAL CAPACITY TO AFFORDABLE Financial capacity of municipalities is the ability to take on debt, generate revenue, or otherwise cover cost of services. For stormwater- a new water infrastructure need how do we do this? What to include in metrics if we are assessing affordability vs budget and financial assurance planning? 13
AFFORDABILTY = FIANANCIAL CAPACITY 1. The affordability assessment is not based on the municipal 5-year implementation costs alone within the Financial Assurance Plan (FAP). 2. Affordability estimates the current (and potential expected) burden of total water service/utility expenditure by households. 3. Costs of implementation are being covered by multiple revenue sources. 4. Costs within the FAP may not include long term maintenance costs or other costs to support the stormwater program. 5. The data captured in the matrix will help assess the long-term sustainability of stormwater funding through recognition that the cost of implementation (and subsequently operations and maintenance) are pulled (pooled) from multiple sources and that all of these costs need to be teased out and tracked to measure affordability to households. 14
CROSS MAPPING DATA FIRST STEPS Affordability for average residential customer: How are your customers characterized? What is the median household income of the customer? (Why Median vs Mean?) The Census website is a wealth of information based on certain Census blocks/County - does this meet your service area? How are costs per household distributed for services? Water related? 15
CROSS MAPPING DATA FIRST STEPS Start to collect data! MHI Does this really characterize your service area? # of households in service area? Multiple categories? Annual average costs per household (past 5-yrs) how will this data be collected? Water? Stormwater? 16
CROSS MAPPING DATA FIRST STEPS Affordability for low income customers How is income distributed? Does MHI characterize it or is it bi- modal ?
CITY EXAMPLE What is the story here? Why are there almost 19% of households <$25,000 in income? Who are the majority of 8.7% (renters <25,000) Newark is a ..anyone?? So 4.7% of MHI is water burden based on average annual cost for the total percent of the population that is a) under $25K and b) under $25K and a renter 18
SOCIOECONOMIC Many parameters can help tell the story of your municipality 1)Unemployment 2)Percent below poverty level Two parameters that help distinguish the community and characterize what the burden may be. 19
CITY EXAMPLE 20
ADDITIONAL FINANCIAL CAPACITY This is a general measure to gauge where the municipality is in reference to the capacity to raise additional funds though bond avenues.

")
")