Analyzing Support for At-Risk Children and Youth to Reduce Offending
The Social Wellbeing Board has tasked the SWA with analyzing data to enhance support for high-need children and young people to prevent offending. Recent statistics show a significant increase in youth crime in Auckland, potentially linked to COVID-19 impacts. Prior research highlights factors like abuse, neglect, mental health issues, and socioeconomic disparities as contributors to offending behavior, emphasizing the importance of targeted interventions.
Download Presentation

Please find below an Image/Link to download the presentation.
The content on the website is provided AS IS for your information and personal use only. It may not be sold, licensed, or shared on other websites without obtaining consent from the author. Download presentation by click this link. If you encounter any issues during the download, it is possible that the publisher has removed the file from their server.
E N D
Presentation Transcript
Bolstering support for children and youth to reduce offending The Social Wellbeing Board requested that the SWA lead analysis that brings together data from agencies to identify where existing support could be bolstered for higher-need groups of children and young people. This analysis uses the IDI to build on previous SWA work to identify factors correlated with joining a gang and becoming involved in the criminal justice system as a young adult. July 2022 A note on the data presented in this slide pack: Correlation does not equal causation Most children and young people don t offend, and most of those who do age out of that behaviour. Only a small minority commit the majority of offences. The data does not tell you what interventions will be most effective for which children, nor can it tell you which individual children to focus on it provides the experiences and needs of a group. The data we generally collect and use is limited to negative experiences - interactions with government agencies generally occurs because additional support is needed; our data does not usually capture what is going well for people despite adverse circumstances.
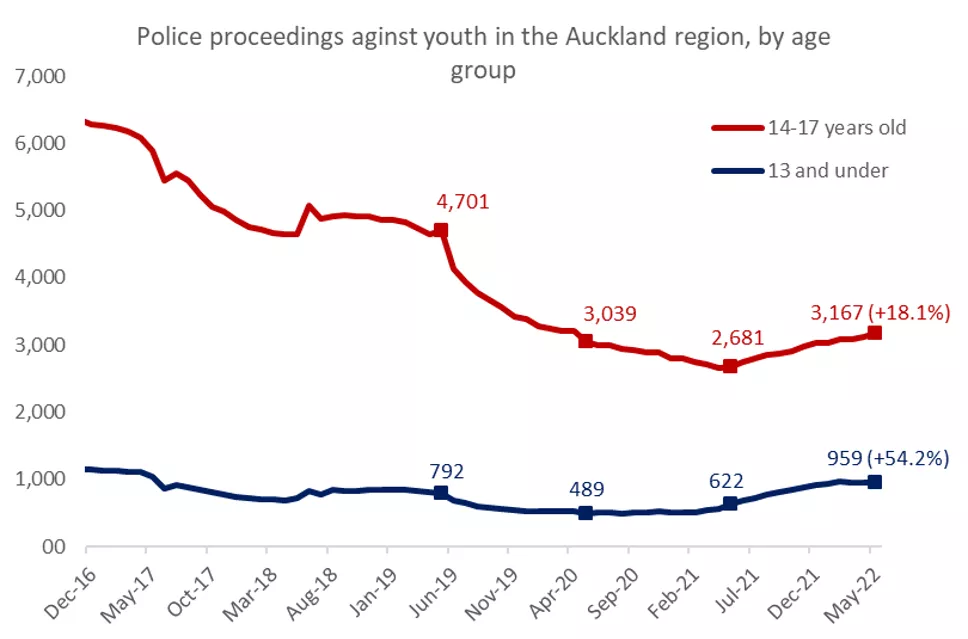
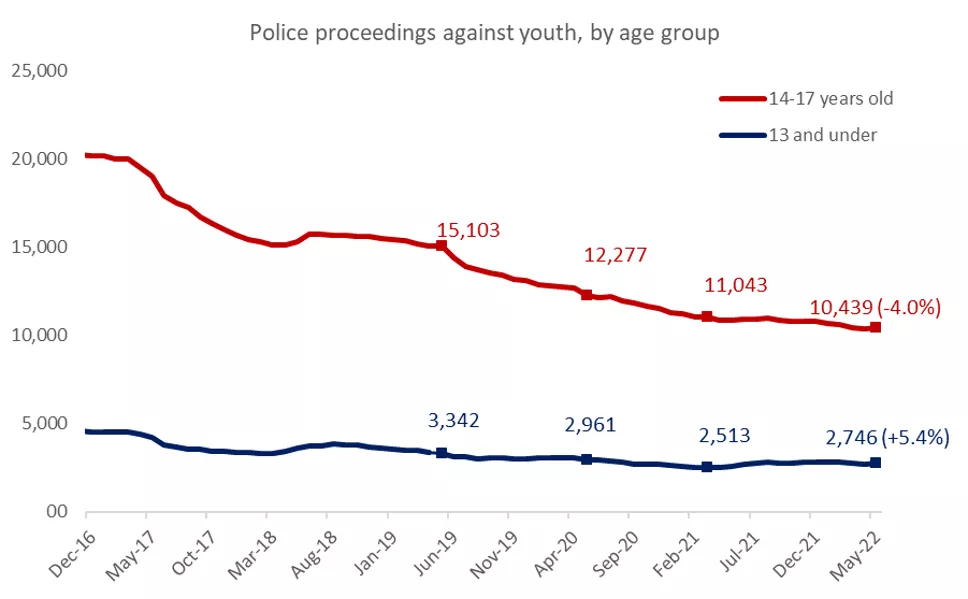
Recent increases in youth crime are concentrated largely in Auckland In the 12 months to May 2022, Police proceedings against youth in Auckland increased by 25% compared to the previous 12 months... Proceedings against children under 13 years increased 54% Proceedings against young people aged 14-17 years increased 18% .....while proceedings decreased by 2% nationally It is possible that increases in Auckland are due to lag effects from the COVID lockdowns, which impacted school attendance and in-person service availability. 2
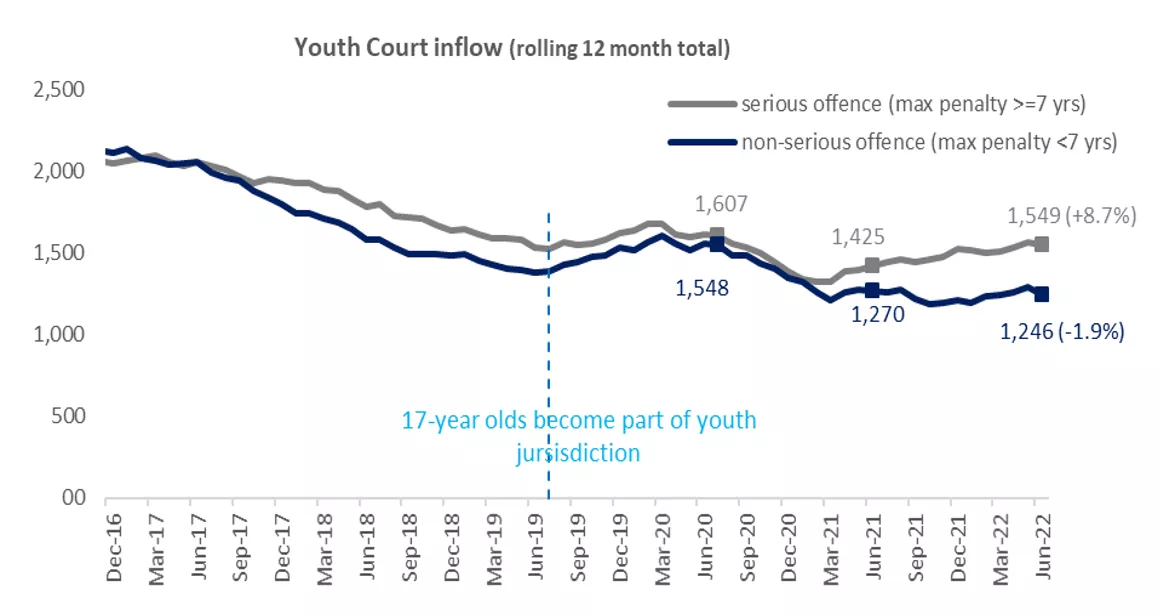
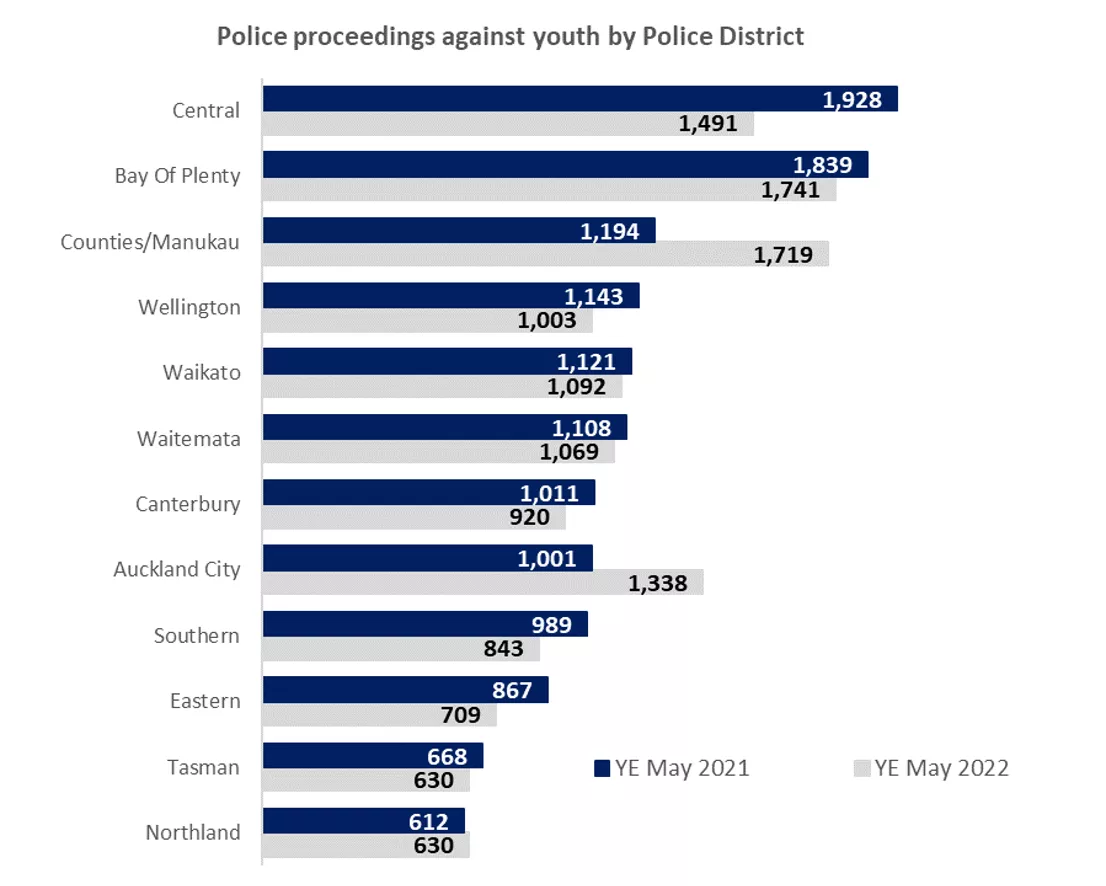
The increase in youth crime was driven by Auckland City and Counties Manukau districts, which increased 34% and 44% in the past year... Prosecutions in the Youth Court for serious offences also increased 9% in the last year, again mostly driven by Auckland and Counties Manukau which increased by 97% and 53%... ...there were also notable increases in: Waikato (38%) Bay of Plenty (18%) Te Taitokerau (29%) Nelson/Malborough (30%) ...every other Police district saw a decrease in the same period, except Northland, which increased slightly by 3% 3
Prior research has shown what factors can lead to offending behaviour Prior research consistently finds that factors that increase the risk of offending behaviour are cumulative. They include: Abuse, neglect and contact with care and protection system Physical, sexual and emotional abuse before 14 are highly correlated with offending. Around one-third of a cohort of 2000 young people in prison identifying as a gang member had been placed in care by 16 Most of those involved in recent ramraids had come to the attention of police as an unaccompanied minor, as well as a missing person. Most were linked to five or more family harm events in the past. Mental health Adverse and traumatic childhood experiences are linked to both mental health and youth offending outcomes. High rates of emergency admissions and specialist mental health services were observed in a cohort of 2000 young people in prison identifying as a gang member. Household and community financial resources Odds of youth offending are about two times higher for those in a decile 1 school at age 9, relative to a decile 10 school. Early offending, victimisation and contact with the justice system 100% of a cohort of 2000 young people in prison identifying as a gang member were reported offenders as children, and over half were also reported victims of crime. Over half of the young people involved in recent ramraids were aged between 10-12 when they first came into contact with police. Disengagement from education More than a third of a cohort of 2000 young people in prison identifying as a gang member had experienced alternative education or unenrolled from school before 16. Almost half had low or no school attainment. Being stood-down or suspended from school is correlated with youth offending, especially when combined with prior histories of offending. 4
We focused on children and youth with experiences that are correlated to offending behaviour Our analysis constructed a measure indicating how these factors cluster among children (7-13) and youth (14-17) Our investigation indicates two age groups for whom additional support could have a positive impact on wellbeing outcomes and potentially reduce offencing behaviour: We used a statistical technique (principal component analysis) to combine a list of 15 different indicators from government administrative data into an overall measure that indicates higher or lower susceptibility to sustained youth offending. These indicators cover four of the five key groups of factors described previously factors relating to disengagement from education did not improve our statistical model, after we accounted for the other factors. Children aged 7-13 years research has indicated that increased investment in early-life support is effective at reducing poor outcomes. Youth aged 14-17 years research shows age- appropriate approaches that improve family functioning and connections with schools, facilitate involvement with socially appropriate peers, and reduce bullying and victimisation are the effective in reducing youth crime and youth gang involvement. We used this measure to focus on the highest needs children and youth We focused on the 10% of children and youth at the top end of our combined measure of factors (born between 2000 and 2010). Not all of these children or youth will be involved in sustained offending now or in the future. However, these are the young people most likely to benefit from effective early intervention, or age-appropriate diversion and supports. We identified regions that might be useful to focus efforts in We have identified a few key regions that either have a high number or high concentration of children and youth who have higher susceptibility to later offending. This aligns with the Social Wellbeing Board s priority to support regional leadership. We can also provide other views of this population that might further suggest targeted supports within some agencies, such as looking at health service usage, prior educational experiences, or overlap with Oranga Tamariki Action Plan priority groups. 5
Children and youth with high support needs are not distributed equally across the country Kawerau District Approx. proportion with high need: Children: 42% |Youth: 40% Our analysis shows that around 10% of children and young people aged between 7-17 years have high or very high support needs. Far North Approx. proportion with high need: Children: 30% |Youth: 29% Whakatane District Approx. proportion with high need: Children: 23% |Youth: 20% Auckland City Approx. proportion with high need: Children: 6% |Youth: 6% These children and youth are concentrated in the lowest socio-economic status areas, although the absolute numbers in each area varies significantly, depending on population. We can see three types of distribution where need is greatest: Counties Manukau Approx. proportion with high need: Children: 17% |Youth: 16% Opotiki District Approx. proportion with high need: Children: 42% |Youth: 39% High concentration of need but low numbers of young people: Kawerau, Wairoa, Opotiki, Whakatane, South Waikato, Gisborne Lower concentration of need but high numbers: Auckland City, Christchurch City High concentration of need and high numbers of children: Counties Manukau there were more high needs children and youth in Counties Manukau than all the other regions noted above. South Waikato District Approx. proportion with high need: Children: 19% |Youth: 20% Gisborne District Approx. proportion with high need: Children: 25% |Youth: 21% Wairoa District Approx. proportion with high need: Children: 31% |Youth: 27% Christchurch City Approx. proportion with high need: Children: 6% |Youth: 7% All Aotearoa New Zealand Proportion with high need: Children: 10% |Youth: 10% While there may be greater urgency to act in the areas identified, above, other factors, such local community priorities and the capacity of agencies to respond to the needs of those communities will also inform where, when and how to intervene to improve wellbeing outcomes. Source: Map DOT Loves Data, 2022 Other data SWA, 2022 Most affluent Most deprived 6
What works to prevent youth crime eg Attendance and Engagement Strategy Before School Check Early childhood education Universal prevention approaches Increasing educational retention and attainment Increasing employment opportunities Reducing deprivation and increasing social cohesion Strengthening communities including community-based programmes that support at-risk families and children. Strengthening schools and early childhood centres training helps teachers and parents manage disruptive young people as well as teaching students interpersonal skills. ECE programmes are beneficial when they target self-regulation, early cognitive abilities, and caregivers warmth, responsiveness, and behavioural management strategies. Individual support with high-needs children including young people diagnosed with conduct and oppositional/defiant disorders Wh nau support and prevention combining ECE programmes for children with family support (eg, parent-management training) eg Youth Crime Action Plan Positive Behaviour for Learning (PB4L) Rangatahi Hub Youth Inclusion Programmes (YIP) Youth Guarantee Programme Alternative education Community and school-level prevention programmes eg Early intervention gang prevention Family Start Functional Family Therapy Youth Mentoring Wh nau Ora Kotahi te Whakaaro konga Fund He Poutama Rangatahi Individual and family prevention programmes 7
Supporting notes Variables used in construction of indicator Abuse, neglect and contact with care and protection system: Child is subject of previous Oranga Tamariki contact and/or report of concern; child is subject of previous Oranga Tamariki investigation; child has had a care and protection placement Early offending, victimisation and contact with the justice system: Child has a prior non-serious offence; an adult in the same household has experience with Corrections. Mental health: Child has received support for mental health or addiction; an adult in the same household has received support for alcohol or drug abuse/dependence; an adult in the same household has received a mental health specialist service. Household and community financial resources: Household income; whether household income is below $20,000; household income relative to neighbourhood average income; whether the household has 4+ children; whether household is supported by main benefit; whether the child lives in low or high deprivation (NZDep) community; whether the last school the child attended was low or high decile. IDI disclaimer These results are not official statistics. They have been created for research purposes from the Integrated Data Infrastructure (IDI) which is carefully managed by Stats NZ. For more information about the IDI please visit https://www.stats.govt.nz/integrated-data/. Access to the data used in this study was provided by Stats NZ under conditions designed to give effect to the security and confidentiality provisions of the Statistics Act 1975. The results presented in this study are the work of the author, not Stats NZ or individual data suppliers. 8

 undefined


