Academic Performance Review at Mearns Academy
Mearns Academy has shown significant improvements in academic performance over the past years, achieving high levels of attainment in various key areas such as SCQF levels 4, 5, and 6. The school has outperformed both Aberdeenshire and national averages in several categories, indicating a positive trend in student achievement. However, there are areas highlighted for further improvement, particularly in literacy and numeracy levels. Overall, Mearns Academy has demonstrated a commitment to academic excellence and continuous progress.

Uploaded on Oct 02, 2024 | 0 Views
Download Presentation

Please find below an Image/Link to download the presentation.
The content on the website is provided AS IS for your information and personal use only. It may not be sold, licensed, or shared on other websites without obtaining consent from the author. Download presentation by click this link. If you encounter any issues during the download, it is possible that the publisher has removed the file from their server.
E N D
Presentation Transcript
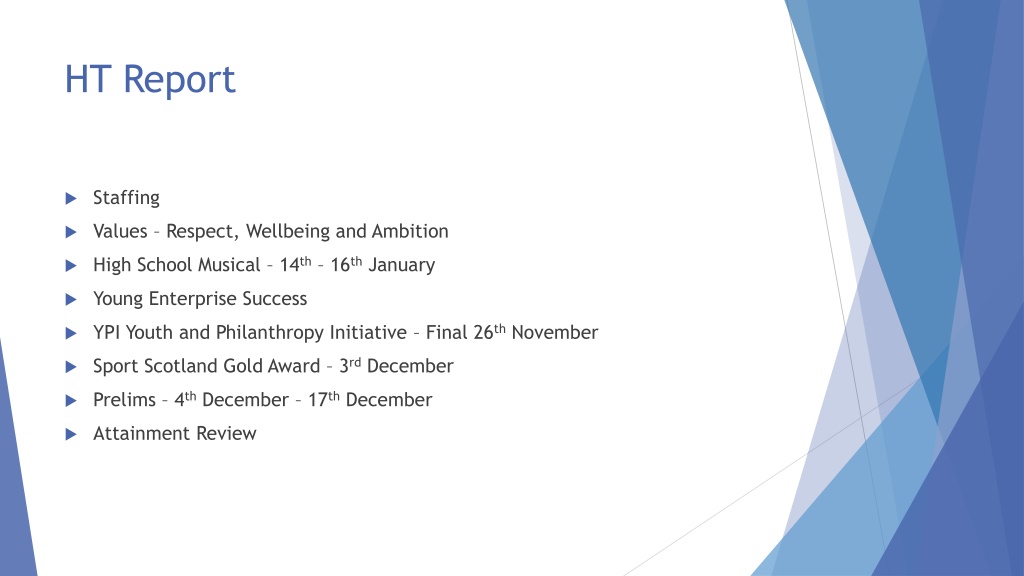
HT Report Staffing Values Respect, Wellbeing and Ambition High School Musical 14th 16thJanuary Young Enterprise Success YPI Youth and Philanthropy Initiative Final 26thNovember Sport Scotland Gold Award 3rdDecember Prelims 4thDecember 17thDecember Attainment Review
Mearns Academy Attainment Review 13thNovember 2019
% Year stage attaining 5 or more awards at SCQF Level 5 or better by end of S4 5+ L5 (S4) Year 2019 2018 2017 2016 2015 2014 Mearns 66.92% 53.57% 48.25% 50.75% 44.92% 41.27% Aberdeenshire 55.19% 52.3% 50.1% 48.7% 45.5% 44.1% National 49.83% 48.3% 46.0% 44.5% 42.5% 39.4% VC Difference (Mearns VC) 10.38% 3.66% 2.64% 6.57% 8.48% 6.51% 56.54% 49.91% 45.61% 44.18% 36.44% 34.76% 10% above VC Highest S4 attainment ever within Mearns Academy VC 7% increase 66% unlikely to be sustainable with current data however goal post have moved Looking for progression and impact into S5 and S6
% Year stage attaining 3 or more awards at SCQF Level 6 or better by the end of S5 3+ L6 (S5) Year Mearns Aberdeenshire National VC Difference (Mearns VC) 44.46% 40.2% 41.9% 38.3% 38.0% 33.2% 42.51% 40.4% 39.6% 38.8% 37% 33.2% 46.70% 40.79% 41.47% 36.13% 32.46% 34.20% 2019 2018 2017 2016 2015 2014 46.09% 41.23% 50.36% 38.71% 42.06% 40.18% -0.61% 0.44% 8.89% 2.58% 9.60% 5.98% 2nd best Higher performance in last 6 years Target 43% Above Abshire and National
Consideration of any other important aspects of performance highlighted by Insight LBMs. We will not discuss performance in relation to every measure at every level. Instead discussion will focus on the following two areas (which were highlighted within the recent report to ECS Committee as areas where there was either a downward trend or a significant fall in 2019), or any specific measure where the data suggests significant improvement or highlights and area for improvement 2. Insight Whole School Local Benchmarking Measures Literacy and Numeracy at SCQF Level 4 Attainment of the lowest attaining 20%/middle attaining 60% at S5
Literacy and Numeracy Level 4 Year Mearns Aberdeenshire National VC Difference (Mearns VC) 83.82% 87.75% 91.94% 91.42% 89.38% 86.59% 82.05% 82.61% 85.49% 83.29% 82.63% 77.38% 84.96% 81.70% 86.14% 83.21% 77.71% 74.44% 2019 2018 2017 2016 2015 2014 95.49% 91.96% 95.61% 97.76% 88.14% 89.68% 10.53% 10.26% 9.47% 14.55% 10.43% 15.24% Literacy and Numeracy at SCQF Level 4
Literacy and Numeracy Level 5 Aberdeenshire Year Mearns National VC Difference (Mearns VC) 2019 2018 2017 2016 2015 2014 59.91% 57.05% 62.73% 59.07% 54.84% 42.54% 53.38% 49.53% 52.29% 47.61% 43.51% 37.64% 57.14% 50.45% 51.93% 46.27% 37.20% 32.22% 72.93% 71.43% 60.53% 70.15% 60.17% 32.54% 15.79% 20.98% 8.60% 23.88% 22.97% 0.32% Literacy and Numeracy at SCQF Level 5
Literacy and Numeracy at SCQF Level 4 Literacy Level 4 Year 2019 2018 2017 2016 2015 2014 Mearns Aberdeenshire National VC Difference (Mearns VC) 92.56% 90.27% 93.25% 91.34% 87.54% 84.84% 96.99% 96.43% 95.61% 97.76% 97.46% 96.83% 4.43% 6.16% 2.36% 6.42% 9.92% 11.99% 92.82% 94.29% 95.0% 94.06% 93.09% 90.6% 92.4% 90.96% 90.83% 88.06% Numeracy Level 4 Year 2019 2018 2017 2016 2015 2014 Mearns Aberdeenshire National VC Difference (Mearns VC) 87.53% 86.16% 88.77% 85.22% 81.02% 72.22% 97.74% 91.96% 95.61% 98.51% 88.14% 90.48% 10.21% 5.80% 6.84% 13.29% 7.12% 18.26% 87.97% 94.6% 93.58% 91.18% 88.35% 84.53% 87.57% 86.12% 84.95% 80.05%
Attainment of the lowest attaining 20% at S4 2015 2016 2017 2018 2019 Mearns Academy 145 176 136 137 192 Virtual Comparator 94 110 124 109 120 Aberdeenshire 131 142 143 118 115 National 104 107 115 101 98
Consideration of any specific courses where there is evidence of under attainment, or where there is evidence of very positive or improving attainment. (Analysis should look at stage and level as appropriate i.e. S4 N5, N4; S5/6 Higher, N5; S6 AH etc.) Again, we will not be able to discuss performance in relation to every course/department/faculty. 3. Course/ Departmental/ Faculty Level Attainment
Course/Departmental/Faculty Level Attainment Areas of strength English Maths French Geography Modern Studies Music ASL
Learning, Teaching & Assessment Whole staff meeting with L&T focus Pupil engagement with L&T Agreed best practice in L&T within Mearns Academy Observations ICT
Although Insight data for 2018/19 is not available until March 2020, a brief discussion around the school s estimate/expectation of the figure based on the data that has been made available this year in arrangement with SDS. 4. Positive destinations
% Year stage attaining 5 or more awards at SCQF Level 5 or better by end of S4 5+ L5 (S4) Year 2019 2018 2017 2016 2015 2014 Mearns 66.92% 53.57% 48.25% 50.75% 44.92% 41.27% Aberdeenshire 55.19% 52.3% 50.1% 48.7% 45.5% 44.1% National 49.83% 48.3% 46.0% 44.5% 42.5% 39.4% VC Difference (Mearns VC) 10.38% 3.66% 2.64% 6.57% 8.48% 6.51% 56.54% 49.91% 45.61% 44.18% 36.44% 34.76% 10% above VC Highest S4 attainment ever within Mearns Academy VC 7% increase 66% unlikely to be sustainable with current data however goal post have moved Looking for progression and impact into S5 and S6