Analysis of Welfare: Consumer and Producer Surplus
This content delves into the analysis of welfare through the concepts of consumer and producer surplus, internal rate of return, and benefits versus costs associated with policy choices. It emphasizes the computation of benefits and costs over long time periods, focusing on direct and indirect measurable impacts. Consumer surplus, producer surplus, and costs related to projects are explored, offering insights into how to measure the total benefits derived from a project. Various graphical representations and explanations provide a comprehensive understanding of welfare analysis.

Uploaded on Oct 08, 2024 | 0 Views
Download Presentation

Please find below an Image/Link to download the presentation.
The content on the website is provided AS IS for your information and personal use only. It may not be sold, licensed, or shared on other websites without obtaining consent from the author. Download presentation by click this link. If you encounter any issues during the download, it is possible that the publisher has removed the file from their server.
E N D
Presentation Transcript
Welfare: Consumer and Producer Surplus and Internal Rate of Return Daniel Mason-D Croz Sherman Robinson
Welfare Analysis We need to compute benefits and costs associated with policy choices Benefits and costs occur over long time periods Discounting to compute present value of a time stream of benefits and costs Social versus market benefits and costs Externalities and non-market costs and benefits We will focus on direct and indirect, measurable, costs and benefits
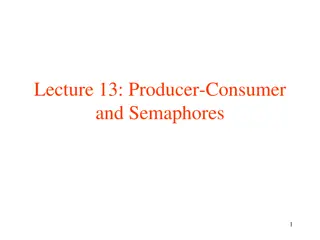
Benefits: Consumer Surplus Measurable gains to demanders from changes in supplies of goods due to projects Idea of Consumer Surplus (CS): the total amount demanders would be willing to pay for a given amount of commodities Changes in CS across all markets affected by a project measure the benefits attributable to that project Direct and indirect effects
Benefits: Producer Surplus Producer surplus measures the net benefits to producers from a project : the change in total revenue minus the change in total costs of production of all producers Direct and indirect effects The sum of changes in Consumer and Producer Surplus measures the total benefits arising from a project
Costs Total costs associated with a project include both the direct costs of the project (e.g., developing a new seed variety) and the indirect impact on costs of linked producers We will measure only the direct financial costs associated with a project Changes in costs of linked sectors will be captured by changes in producer surplus, which are measured from the net benefit side.
Consumer Surplus PC Reference Consumer Surplus PIntsimulation Simulation Consumer Surplus PIntref Income Effect Price Effect Both Income and Price Effect (gains from income changes lost to price changes) Psimulation Pref QF Qref Qsimulation Q*
Virtual Supply Curves Need to generate a virtual supply curve, given yield and land area equations Virtual because it is not generated from a fully specified cost function Yield and area are both functions of producer prices, with constant elasticities Supply elasticity is the sum of these two elasticities Constant is the product of the two constants
Producer Surplus PP Psimulation Agricultural Revenue Producer Surplus Total Cost Qsimulation QS
Producer Surplus We need to find the area under a non-linear, constant-elasticity supply curve. After some algebra, that area is equal to: ?? = ? ?? =? ?? 1 + ? Which is equal to total revenue times 1 over 1 + the elasticity of supply.
Benefit-Cost Analysis Can use CS and PS to measure benefits of introducing some change such as a new technology Need to discount CS and PS over time and compute net present value (NPV) of benefits Need cost data over time to compute NPV of costs
Net Present Values ? ? ???????????? 1 + ?? ??? ???????????? = ?=1 ? ? ???????????? 1 + ?? ??? ???????????? = ?=1
Net Present Values ??? ????? ?????????????????? = ??? ???????????? + ??? ???????????? ? ? ?????????????? 1 + ?? ???(??????????????) = ?=1
Benefit-Cost and Internal Rate of Return ???(????? ??????????????????) ???(??????????????) ??? ? ? ? ? ( ???????????? + ???????????? 1 + ???? ) ?????????????? = = 0 ?=1
Internal Rate of Return IRR calculation is done by using the GAMS solver to find a solution to the equation If NPV of costs exceeds NPV of benefits, the IRR does not exist We check for this condition and do not try to solve for the IRR in this case
Technology Adoption and Costs Technology Adoption Pathway Module Pre-processing module the creates data to be read in by IMPACT food module Allows users to specify regions, and timing for technology adoption Critical to test several adoption scenarios, to inform ex-ante analysis of different technologies
Technology Adoption and Costs Costs are currently exogenous and supplied by the users Technology adoption costs comes in 3 forms: Global Costs: Not tied to a specific country (e.g. CG- center investments) National R&D Costs: Costs incurred at the country level to develop and implement a technology (e.g. National Research centers) Extension Costs: Costs incurred at country level to implement a technology in the field Multiple cost scenarios should be used to test cost sensitivity in the benefit-cost analysis