Conservation Efforts for Wildlife in Georgia
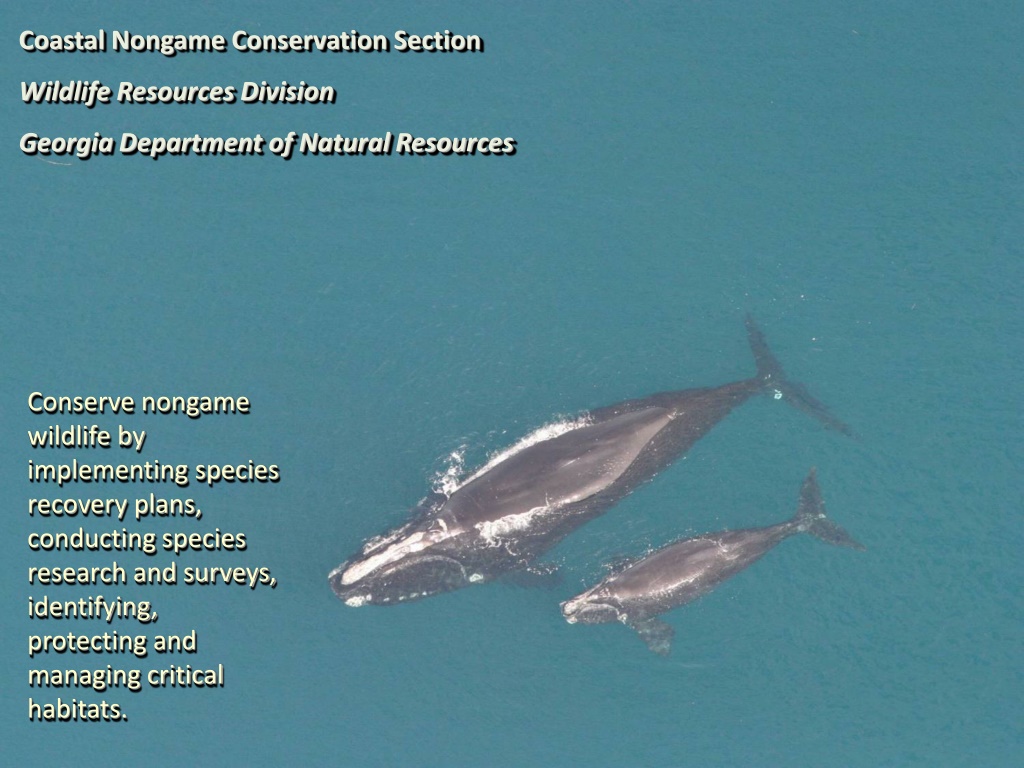
The Coastal Nongame Conservation Section of the Wildlife Resources Division at the Georgia Department of Natural Resources is dedicated to conserving nongame wildlife through species recovery plans, research, surveys, and habitat management. They focus on managing recovery programs, acquiring land, conducting habitat analysis, and monitoring species such as loggerhead turtles, right whales, and manatees. These efforts aim to protect and enhance wildlife populations and their habitats in Georgia.
- Wildlife Conservation
- Georgia Department of Natural Resources
- Habitat Management
- Species Recovery
- Nongame Wildlife

Download Presentation

Please find below an Image/Link to download the presentation.
The content on the website is provided AS IS for your information and personal use only. It may not be sold, licensed, or shared on other websites without obtaining consent from the author. Download presentation by click this link. If you encounter any issues during the download, it is possible that the publisher has removed the file from their server.
E N D
Presentation Transcript
Coastal Nongame Conservation Section Wildlife Resources Division Georgia Department of Natural Resources Conserve nongame wildlife by implementing species recovery plans, conducting species research and surveys, identifying, protecting and managing critical habitats.
Nongame Conservation Two primary methods Managing recovery programs of species already listed on ESA (Section 6) Keeping common species common, BEFORE they are listed. SWG Land Acquisition (NAWCA/NCWCG/etc)
Habitat Analysis Utilize data to determine what habitats are threatened, abundant, degraded Which species depend on those habitats State Wildlife Action Plan
Loggerhead Nesting Trend in Georgia, 1989-2016 Comprehensive Statewide Surveys (n=28) -Georgia DNR has coordinated comprehensive nesting surveys since 1989 (n=28 years) -Significant increasing trend in nesting and adult females (3% annually). -Surpassed NOAA/USFWS recovery goal of 2,800 nests in 2016. -Other demographic criteria must be met prior to delisting, but nesting data shows a recovering population. 3500 3000 Number of Nests 2500 2000 1500 1000 500 0 1989 1991 1993 1995 1997 1999 2001 2003 2005 2007 2009 2011 2013 2015
Southeast Right Whale Project- Section 6 DNR, Florida FWC, Sea to Shore Alliance, NOAA and other partners At least 475 whales, increasing at 2.8% per year as of 2011 Low number of calves and total sightings in Southeast in recent years Unclear if recent declines will impact population growth Primary threats remain: Ship strikes Commercial fishery entanglement Emerging threats: Anthropogenic noise Climate change Other habitat impacts Current projects: Aerial and boat surveys Genetic sampling Satellite telemetry Drone photogrammetry Satellite Tracks 2015: S078 Eg4092 2016: Eg4040 Eg4094
Manatee Project- Section 6 DNR, Florida FWC, Sea to Shore Alliance, FWS and other partners At least 6,250 manatees, all subpopulations stable or increasing Average around 50 per year in GA Proposed for down-listing to threatened Primary threats remain: Boat strikes Red tides Warm water availability Habitat degradation Current projects: Kings Bay satellite telemetry Photo-ID Monitoring artificial warm water outfalls Manatee #TGA011 GPS Positions
Coastal Bird Conservation and Management Research Management Monitoring Education http://www.cumminghome.com/bm~pix/suwanee~s600x600.jpg
Marine and Maritime Habitat Management Regulate fisheries (ESA; for example TEDs) Saltmarsh (MPA) Development (SPA and Land Acquisition) Water Quality and Quantity (CWA; EPA, local govn s)
Marine and Maritime Habitat Status Coastal Wildlife populations indicate relative favorable health for beach/shore, marsh and marine habitats. What reference point? Oyster populations are a fraction of pre- colonial #s
Marine and Maritime Habitat Status Over 617k people in Coastal Ga. 6% past 5 years Connected biologically to many parts of the world (migratory birds, migratory whales, fisheries) and through 2 major Ports
Habitat and Rare Plant Conservation and Monitoring Natural Community and Rare Plant Surveys Vegetation Monitoring Conservation Planning Habitat Mapping
Invasive Species Assessment and Management Assessment (Mapping) Monitoring (Treatment effectiveness) Education & Outreach Management (Control)
Beaches and Marsh Exist at MSL under favorable conditions Due to conservation lands, lack of shoreline hardening, and natural topography, conditions are favorable here for several feet of SLR
Tier 1 (barrier and marsh islands) 36% developed Tier 2 (adjacent to coast) 86 % developed Coast consists of barrier islands, former barrier islands (now upland sand ridges), saltmarsh and former salt marsh (now flatwoods). Former marshes (now flatwoods) are poorly drained and not easily developed, especially close to the coast.
Coastal Habitats Desirable for Development, yet: Contains the most contiguous protected area in GA (Barrier Islands and Saltmarsh) adjacent Coast is a mix of development, conservation, agriculture and forestry
Coastal Habitats result is that many coastal habitats, although not pristine, are abundant and thriving here Some are diminishing or threatened
USNVC Alliance Level on immediate Coast Association Level near Coast
3.9 M total acres 1.57 M acres natural vegetation (including saltmarsh) 370 K upland acres 1.2 M wetland acres 736 K acres (20%) total conservation (not including saltmarsh) 509 K (14%) natural vegetation in conservation (not including saltmarsh)
Acres of Natural Vegetation, Coastal Georgia Acres 500000 450000 400000 350000 300000 250000 200000 150000 100000 50000 0 Riverine Maritime Forest Barrier Island Wetlands Beaches Isolated/Other Wetlands Pine Flatwoods Longleaf Savannah Evergreen Hammocks
What happened? 1.6 M acres natural vegetation (including 400K acres of saltmarsh) 370 K upland acres 1.2 M wetland acres 2.3 M acres (60%) converted to anthropogenic uses (mostly uplands, flatwoods and depressional wetlands Originally there were appx 530K longleaf uplands and 2 Million acres of flatwoods and depressional wetlands
What happened? Ditching and draining work on depressional wetlands Riverine harder to drain, but depressional (and other) draining does affect all habitat types by lowering water table
Terrestrial Impacts The great longleaf pine savannah, only remnants left Longleaf flatwoods habitat, significantly reduced/degraded Isolated wetlands significant but unknown loss
Biological processes Fire has been mostly removed Fragmentation/landuse Hydrology has been greatly affected in all habitats (ditching, draining, impervious) Climate is shifting Invasive species
Biological processes Coastal processes mostly intact Fisheries
The mean sea level trend is 3.17 millimeters/year with a 95% confidence interval of +/- 0.28 mm/yr based on monthly mean sea level data from 1935 to 2015 which is equivalent to a change of 1.04 feet in 100 years
Past Decade MSL Trend Fort Pulaski, Georgia 0.2 6 inches! 0.18 0.16 0.14 0.12 Meters 0.1 0.08 0.06 0.04 0.02 0 2006 2007 2008 2009 2010 2011 2012 2013 2014 2015 2016 Years
# of Extreme Tides Per Year 60 50 40 # of tides 30 20 10 0 1930 1940 1950 1960 1970 1980 1990 2000 2010 2020 Years # 5' MSL tides 5.5' MSL 6' MSL Poly. (# 5' MSL tides) Poly. (5.5' MSL)
What are we focusing on? Conserve and restore rare habitats/species Conserve and restore Uplands Preserve and Create Connectivity
Altama Restoration & Monitoring
Currently 8.5%, or 3.1 M acres out of State's 37 M in Conservation Each Priority level is 1 M acres, totaling 16% of State Serve as corridors for many threatened and common species: RCW, Indigo Snake, Gopher Tortoise, Black Bear Connect up to Florida s planned Corridor System
Acres by Elevation Class Elevation by Size Class for GA Coast in Feet (Mean Sea Level) Acres 180000 160000 140000 120000 100000 80000 60000 40000 20000 0 MSL Feet