Netdata - The Open Source Observability Platform: A Comprehensive Overview


Netdata
the open-source observability
platform everyone needs

Costa Tsaousis
2
About Netdata
●
Born out of a need
While migrating a large infra from on-prem to cloud, we were facing unexplainable
issues - existing monitoring solutions (open-source and commercial) failed to
diagnose, or even surface.
●
Born out of curiosity
Experimented to understand if and how a monitoring solution could be real-time,
high-resolution, easier, simpler and out of the box.
●
Born on GitHub, open-source from the very beginning
The love and adoption by the community gave substance
and a future to Netdata.
GitHub URL:
●
Auto-discover
800+ integrations and k8s autodiscovery supported.
●
Collect
Pull and Push model, using the optimal protocol for each application.
●
Store
Embedded high performance time-series database.
●
Learn
Unsupervised Machine Learning for every metric.
●
Check
Predefined & custom alerts and notifications.
●
Query & Score
API for querying, analyzing, scoring and correlating time-series data.
●
Visualize
Fully automated dashboards.
●
Stream & Replicate
Build metrics centralization points.
Netdata is a
monitoring
in a box
3
The Netdata way
●
200+ dashboard chars, 2000+ unique time-series
CPU, Memory, Disks, Mount Points, Filesystems, Network Interfaces, the whole Networking Stack
for all Protocols, Firewall, systemd Units, Processes, Users, User Groups and more.
All collected and visualized with
1-second granularity
.
●
50+ unique alerts, on 100+ components
Checking the health of every single component the system has, for common errors,
misconfigurations, and error conditions.
●
systemd-journal logs explorer
Visualize the explore system and application logs, by directly querying systemd journals, without the
need of logs database server.
●
Network explorer
Visually explore all network sockets (to be release this month).
●
Unsupervised anomaly detection
18 Machine Learning models are trained for each time-series collected, modeling the behavior of
each metric over the last few days, offering outlier detection in real-time, during data collection.
●
2 months of retention using 500MB of disk space
3 days of high-res (per-sec), 2 weeks of mid-res (per-min), 2 months of low-res (per-hour).
●
1% CPU of a single core, 120MB RAM, almost zero disk I/O
Optimized for speed and efficiency, a nice companion for production systems and applications.
What you get
by just
installing
Netdata
on
an
empty
VM
4
Netdata on an
empty
VM
5
The Netdata way - standalone
S1
S2
S3
S4
S5
Dashboards
Metrics & Logs
Alerting
Install the agent on all your systems.
Servers
6
The Netdata way - distributed fully on-prem
S1
S2
S3
S4
S5
Cloud Provider 1
Dashboards
Metrics & Logs
Alerting
Install the agent on all your systems,
Use a Netdata Parent for a unified view.
Servers
Netdata Parent is the same open-source
software to all other Netdata.
S6
Netdata Parent
GP
7
The Netdata way - multi-level
A1
A2
A3
A4
A5
B1
B2
B3
B4
B5
C1
C2
C3
C4
C5
PA
PB
PC
Data Center 1
Data Center 2
Cloud Provider 1
Dashboards
Metrics & Logs
Alerting
Netdata Parent
Netdata Parent
Netdata Parent
Netdata
Grandparent
●
-35% CPU Utilization
Netdata: 1.8 CPU cores per million of metrics/s
Prometheus: 2.9 CPU cores per million of metrics/s
●
-49% Peak Memory Consumption
Netdata: 49 GIB
Prometheus: 89 GiB
●
-12% Bandwidth
Netdata: 227 Mbps
Prometheus: 257 Mbps
●
-98% Disk I/O
Netdata: 3 MiB/s (no reads, 3 MiB/s writes)
Prometheus: 129 MiB/s (73.6 MiB/s reads, 55.2 MiB/s writes)
●
-75% Storage Footprint
Netdata: 10 days per-sec, 43 days per-min, 467 days per-hour
Prometheus: 7 days per-sec
Stress tested
Netdata
parent
and
Prometheus
with 500 servers,
40k containers,
at 2.7 million
metrics/s
8
Netdata vs Prometheus
:full comparison URL
In December 2023,
University of Amsterdam
published a study
related to the impact of monitoring tools for Docker based systems,
aiming to answer 2 questions:
1.
What is the impact of monitoring tools on the energy efficiency of
Docker-based systems?
2.
What is the impact of monitoring tools on the performance of
Docker-based systems?
They tested ELK, Prometheus, Netdata and Zipkin, under 9 different
configurations.
This is how Netdata stands:
-
Netdata excels in energy efficiency: "...
Netdata being the
most energy-efficient tool
...", as the study says.
-
Netdata excels in CPU Usage, RAM Usage and Execution Time.
Netdata
outperforms all
other monitoring
solutions in
energy efficiency!
9
Netdata is the most energy efficient platform!
:full comparison URL
●
Netdata
66.9k stars
The open-source observability platform everyone needs!
●
Elasticsearch
66.6k stars
Free and Open, Distributed, RESTful Search Engine.
●
Grafana
59.1k stars
The open and composable observability and data visualization platform. Visualize
metrics, logs, and traces from multiple sources like Prometheus, Loki,
Elasticsearch, InfluxDB, Postgres and many more.
●
Prometheus
51.6k stars
The Prometheus monitoring system and time series database.
●
Jaeger
19.0k stars
CNCF Jaeger, a Distributed Tracing Platform.
●
Fluentd
12.6k stars
Fluentd: Unified Logging Layer (project under CNCF).
Netdata is
leading the
observability
category in the
CNCF landscape,
in terms of
users’ love.
10
Netdata in CFNF
Disclaimer: Netdata is a member of, and supports CNCF, but the project is not endorsed nor incubating in CNCF (because we don’t want to).
This list indicates only users’ love, expressed as Github stars.
Netdata
Challenge 1:
from zero to hero, today!
●
Similar physical or virtual hardware
We all use a finite set of physical and virtual hardware. This
hardware may be different in terms of performance and
capacity, but the technologies involved are standardized.
●
Similar operating systems
We all use flavors of a small set of operating systems,
exposing a finite set of metrics covering the monitoring of all
system components and operating system layers.
●
Packaged applications
Most of our infrastructure is based on packaged applications,
like web servers, database servers, message brokers, caching
servers, etc.
●
Standard libraries
Even for our custom applications, we usually rely on packaged
libraries that expose telemetry in a finite and predictable way.
Since we have
so much in
common, why it
takes so long to
set up a
monitoring
solution?
12
We have a lot in common
●
Nodes
The node the data are coming from.
●
Contexts
The kind of metrics, like “disk.io”, “cgroup.cpu”, “nginx.requests”.
Equivalent with the metric name in Prometheus.
●
Instances
The unique instances of the things being monitored. For example
“/dev/sda” and “/dev/sdb” are two instances (disks) for which we
monitor “disk.io” (context).
Equivalent of a combination of some of the labels of a metric in Prometheus.
●
Dimensions
The attributes of the instances monitored. For example “read” and
“write” are Dimensions of the “disk.io” context, of the “/dev/sda”
instance (disk). Dimensions get values and maintain a time-series.
Equivalent of a unique time-series in Prometheus.
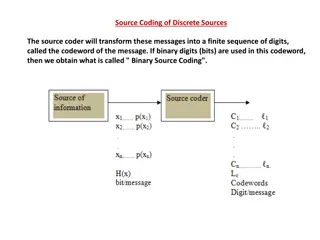
NIDL stands for:
-
N
odes
-
I
nstances
-
D
imensions
-
L
abels
The name comes from the slicing
and dicing controls on all Netdata
charts.
13
NIDL, the model for rapid deployment
14
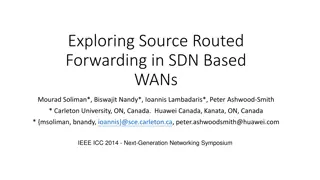
NIDL: how it looks?
Context
(disk.io)
Every chart on the dashboard is a
context
,
aggregating all the
instances
from all
nodes
selected, for the visible timeframe.
Dashboard configuration is done per
context
.
Example: apply units to all dimensions, set default dicing
settings, provide additional information to help users
understand what they see, and more.
Instance
(/dev/sda)
Instance
(/dev/sdb)
Instance
(/dev/sdc)
read
write
read
write
read
write
Alerts
are configured for
contexts
, but they are
applied to
instances
.
Example: “apply this disk.io alert to all disks” or even
“apply this disk.io alert to all NVME disks”.
Instances
have
labels
, and
alert
variables
related to the component they refer to (for
example, disks have a model, a serial number, a
kind, etc).
Dimensions have values, time-series data.
Variables lookup is
smart
to match the
component the
alert is linked to.
15
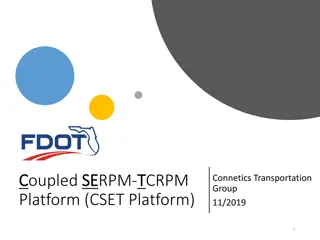
NIDL: how it looks?
Component 1
/dev/sda
Instance
(of disk.io)
MiB/s
Instance
(of disk.ops)
IOPs
Instance
(of disk.busy)
ms
read
write
read
write
busy
Component 2
/dev/sdb
Instance
(of disk.io)
MiB/s
Instance
(of disk.ops)
IOPs
Instance
(of disk.busy)
ms
read
write
read
write
busy
Common
Label
Values
Common
Label
Values
Common Units,
Dimension names,
Variable names
Common
Label names
●
Fully automated visualization
Netdata visualizes all metrics in a meaningful way, by
correlating the right dimensions together and applying the
right settings for each case.
●
Fully automated alerts
Netdata comes with preconfigured alerts for 350 unique
components and applications. All these alert templates are
applied automatically to the right components, applications
and charts.
●
Slice and dice easily from the UI
The NIDL framework enables easy slicing and dicing of the
data from the UI, without the need to learn a query language.
Netdata
incorporates all
the knowledge
and skills
required to set
up a monitoring
system
16
NIDL: the result
●
Just install it
One moving part: Netdata. Batteries included!
(i.e. data collection plugins and all needed modules are shipped with Netdata).
●
Auto-discovers all metrics
Data collection does not require configuration, unless the monitored data are
password protected (Netdata needs the password).
Data collection plugins provide metrics with the NIDL framework embedded
into them.
●
Fully automated visualization
Dashboards are available 1 second after Netdata starts.
●
Pre-configured alerts
If something is wrong, an alert will fire-up just a few seconds after installation.
●
High Fidelity
High granularity: per second data collection and visualization as a standard.
High cardinality: the more metrics the better the troubleshooting gets.
Designed to be
installed mid-
crisis!
17
Mission accomplished!
Netdata
Challenge 2:
get rid of the
query language
for slicing and dicing data
●
Since users haven’t configured the metrics
themselves, can we provide a UI that can
explain what users see?
●
How users will be able to slice and dice the
data on any chart, the way it makes sense for
them?
Netdata
collects a vast
number of
metrics you will
probably see for
the first time
19
Slice and dice from the UI
20
A Netdata Chart
Netdata Cloud Live Demo URL:
:Netdata Parent URL
21
Info Button: Help about this chart
Info button includes links to relevant documentation
and/or some helpful message about the metrics on each
chart.
22
A Netdata Chart - controls
Anomaly
rate ribbon
NIDL Controls - review data sources and slice/filter them
(NIDL = Nodes, Instances, Dimensions, Labels)
Aggregation
across time
Aggregation
across metrics
Info
ribbon
Dice
the data
23
A Netdata Chart - anomaly rate per node
Instances per Node
contributing to this chart
Unique time-series per Node
contributing to this chart
The visible volume each Node
is contributing to this chart
The anomaly rate each Node
contributes to this chart
Clicked
on
Nodes
The minimum, average and maximum
values across all metrics this Node
contributes
Similar analysis is available per Instance
(“application” in this chart), dimensions, and
labels.
Filter Nodes
contributing data to this chart
24
Dicing any chart, without queries
Result: dimension,device_type
25
Info Ribbon: Missing data collections
A missed data collection is a gap, because something is wrong!
Netdata does not smooth out the data.
The Netdata query engine, does all the calculations, for all
drop down menus and ribbons
in one go
and returns
everything in
a single query response
.
All queries, include all information needed:
-
Per Node
-
Per Instance (disk, container, database, etc)
-
Per Dimension
-
Per Label Key
-
Per Label Value
Providing:
-
Availability of the samples (gaps), over time
-
Min, Average and Maximum values
-
Anomaly Rate for the visible timeframe
-
Volume contributing to the chart
-
Number of Nodes, Instances, Dimensions, Label Keys, Label
Values matched
All this
additional
information is
available on
every query,
every chart,
every metric!
26
Mission accomplished!
Netdata
Challenge 3:
make
machine learning and anomaly
detection
useful for observability
Wednesday, 2 October, 2019
Todd Underwood, Google
The vast majority of proposed production engineering uses
of Machine Learning (ML)
will never work
. They are
structurally unsuited to their intended purposes. There are
many key problem domains where SREs want to apply ML
but most of them do not have the right characteristics to be
feasible in the way that we hope. After addressing the most
common proposed uses of ML for production engineering
and explaining why they won't work, several options will be
considered, including approaches to evaluating proposed
applications of ML for feasibility.
ML cannot solve most of
the problems most people want it to
, but it can solve
some problems. Probably.
Google:
All of Our ML
Ideas Are Bad
(and We Should Feel Bad)
28
AI for observability is tricky
:URL
●
Trains a ML model per metric,
every 3 hours
, using the last 6
hours of data of each metric.
●
Maintains
18 ML models
per metric,
covering the last few days.
●
Detects anomalies in real-time,
while data are being collected every second.
●
All available ML models for a metric need to agree
that a collected sample is an outlier, for Netdata to
consider it an
Anomaly
.
●
Stores Anomaly Rate together with collected data.
●
Calculates
Host-level Anomaly Score
.
Default
ML Configuration
In Netdata
29
What does Netdata do with Machine Learning?
●
A
scoring engine
, a unique feature
across all monitoring systems.
●
All metrics, independently of their
context, can be scored across time,
based on various parameters, including
their anomaly rate.
●
Metrics correlations
is a subset of the
scoring engine, that can score metrics
based on their rate of change (data),
anomaly rate of change (anomaly rate),
but also based on volume, similarity, and
more.
Netdata can score
all metrics based
on their anomaly
rate for any given
time-frame!
30
Netdata’s scoring engine
31
A Netdata dashboard
One fully automated
dashboard, with infinite
scrolling, presenting and
grouping all metrics
available.
Quick access to all sections
using the index on the right.
Multi-dimensional data on
every chart, using chart
controls to slice and dice
any dataset.
AI assisting on every step.
32
A Netdata Dashboard - what is anomalous?
Time-frame picker
Anomaly rate
per section for
the time-frame
Anomaly Rate button
●
Uses
Host Anomaly Rate
to identify
durations of interest.
●
Host Anomaly Rate
is the percentage of
the metrics of a host, that were found to
be anomalous concurrently.
●
So, 10% host anomaly rate, means that
10% of all the metrics the host exposes,
were anomalous at the same time,
showing the spread of an anomaly.
Anomaly advisor
assists in finding
the needle in the
haystack.
33
Anomaly Advisor
34
Anomaly Advisor - starting point
Percentage of
Host Anomaly
Rate
Number of metrics
concurrently
anomalous
35
Anomaly Advisor - triggering the analysis
Highlighting an area
on the chart, triggers
the analysis
36
Anomaly Advisor - the analysis
Anomaly advisor
presents a
sorted
list of all metrics
,
ordered by their
anomaly rate
,
during the
highlighted time-
frame.
Netdata turns AI to a consultant that can help you spot
what is interesting, what is related, what needs your
attention.
●
Unsupervised
There are plenty of settings, but it just works behind the
scenes, learning how metrics behave and providing an
anomaly score for them.
●
It is just another attribute for each of your metrics
Anomaly Rate is stored in the metrics database together with
every sample collected, making it possible to query the past
for anomalies.
●
Can detect the
spread of an anomaly
across systems
and applications.
●
Can assist finding the
aha! moment
while
troubleshooting.
Unsupervised
Anomaly
Detection is an
advisor!
37
Mission accomplished!
Netdata
Challenge 4:
Make
logs exploration and analytics
,
easy and affordable.
●
Is available everywhere!
We use it already, even when we don’t realize it.
●
Is secure by design!
○
FSS, to seal the logs
○
Survives disk failures (uses tmpfs)
○
Its file format is designed for minimal data loss on disk
corruption
●
Is unique!
○
Supports any number of fields, even per log entry
(think huge cardinality)
○
Indexes all fields provided
○
Queries on any combination of fields
○
Maintenance free - just works!
●
Amazing ingestion performance!
●
Can build logs centralization points
It provides all the tools and processes to centralize all the
logs of an infra to a central place.
systemd-journald
is a hidden gem,
that already lives
in our systems!
39
Systemd-journald
40
Netdata systemd-journal Logs Explorer
●
Yes and No.
The query performance issues are simple implementation
glitches, easy to fix.
●
We submitted patches to systemd
We analyzed
journalctl
and found several issues that once
fixed they improve query performance 14x.
We submitted these patches to systemd.
●
Netdata systemd-journal Explorer
We managed to bypass all the performance issues systemd-
journal has, independently of the version of systemd installed
on a system.
Netdata is fast when querying systemd-journal logs on all
systems, even with a slow systemd-journal and
journalctl
.
systemd-journal
is not slow when
used with
Netdata
41
Systemd-journald: it is slow to query
●
Yes it did.
Generally, very few tools are available to push structured logs
to systemd-journals.
●
Netdata
log2journal
We released
log2journal
, a powerful command line tool to
convert any kind of log into structured systemd-journal
entries. Think of it as the equivalent to
promtail
.
For
json
and
logfmt
formatted logs, almost zero
configuration is needed.
●
Netdata
systemd-cat-native
We released
systemd-cat-native
, a tool similar to the
standard
systemd-cat
, which however allows sending a
stream of entries formatted in the systemd-journal native
format to a local or remote systemd-journald.
The value of a
logging system
depends on its
integrations
42
Systemd-journald: it lacks integrations
:URL for
log2journal
The storage requirements for systemd-journal files are
significantly higher
than other log management solutions,
like Loki.
So, systemd-journald:
-
outperforms others in ingestion performance
-
uses significantly less resources during ingestion,
-
is way more secure, reliable and fault tolerant,
-
is the definition of flexibility, supporting any number
of fields, in any cardinality,
It has a drawback:
it needs a lot more disk space for the same data!
In our tests: 10 times more.
A compressed filesystem can help reduce this to 4 times more.
The key
weakness of
systemd-journald
is its storage
space
requirements
43
Systemd-journald: key weakness
Netdata provides all the tools and dashboards to explore
and analyse your system and applications logs, without
actually requiring a dedicated logs database server.
Despite the storage requirements of systemd-journald, the
tool is amazing, especially for developers, since it provides
great flexibility and troubleshooting features.
Even if you don’t want to push your traefik, haproxy or
nginx access logs to it due to its storage requirements,
we
strongly recommend to use it for application error logs
and exceptions
. Your troubleshooting efforts can become
a lot simpler with this environment.
Netdata provides
the easiest and
more efficient way
to access your
logs, by utilizing
resources and
tools you already
use today.
44
Mission accomplished!
Netdata
Challenge 5:
Observability is more than metrics, logs
and traces. What is missing?
To completely understand or effectively troubleshoot an
issue, metrics, logs and traces may not be enough.
What if we need to examine:
●
the
slow queries on a database
,
●
the list of
network connections
an application has,
●
the
files in a filesystem
,
●
… and the plethora of non-metric, non-log, non-
tracing information available?
Most monitoring systems give up. You have to use the
console of your database server, ssh to the server, or (for
others :) restart the problematic component or application
and hope the issue goes away…
Can a monitoring system help?
To completely
understand, or
effectively
troubleshoot an
issue, we need
more!
46
Challenge
plugin
GP
47
Netdata Functions
A1
A2
A3
A4
A5
B1
B2
B3
B4
B5
C1
C2
C3
C4
C5
PA
PB
PC
Data Center 1
Data Center 2
Cloud Provider 1
User is accessing a
function exposed by
a data collection
plugin on B5
Alerting
Netdata Parent
Netdata Parent
Netdata Parent
Netdata
Grandparent
function
48
Example: Network Connections Explorer
●
Data collection plugins expose
Functions
.
Functions have a name, some parameters, accept a payload,
return a payload and require some permissions to access them.
All these can be custom for each and every function.
●
Parents are aware of their childrens’
Functions
.
Parents are updated in real-time about changes to Functions, so
that all nodes involved in a streaming and replication chain are
always up to date for the available functions of the entire infra
behind them.
●
Dashboards provide the list of
Functions
.
●
Netdata UI supports widgets for
Functions
.
We are standardizing a set of UI widgets capable of presenting
different kinds of data, depending on which is the most
appropriate way for them to be presented.
Functions are
data collection
plugin features
to query non-
metric data of
any kind
49
Mission accomplished!
Netdata
Monetization Strategy
●
Horizontal Scalability
NC provides unified dashboards and alerts, and dispatches alerts centrally,
without the need to centralize all data on one server. Behind the scenes it queries
multiple Netdata and aggregates their responses on the fly.
●
Role Based Access Control (RBAC)
NC allows grouping infrastructure and users in “war rooms”, limiting and
controlling users’ access to the infrastructure.
NC also acts as a Single-Sign-On provider for all your Netdata, limiting what users
can see even when they access Netdata directly.
●
Access from anywhere
NC allows accessing your Netdata servers from anywhere, without the need for a
VPN.
●
Mobile App for Notifications
NC enables the use of the Netdata Mobile App (iOS, Android) for receiving alert
notifications.
●
Persisted Customizations and Dynamic Configuration
NC enables dynamic configuration and stores user settings, custom dashboards,
personalized views and related settings and options, per node, user, room, and
space.
Netdata Cloud (NC)
complements
Netdata
51
Monetization through SaaS
IMPORTANT
Netdata Cloud does not centralize your data.
Your data are always, and exclusively on-prem, inside the Netdata you install.
Netdata Cloud queries your Netdata in real-time, to present dashboards and alerts.
Thank You!
Costa Tsaousis
:GitHub URL, https://github.com/netdata/netdata
●
High fidelity monitoring
All metrics are collected per second.
Thousands versus hundreds of metrics.
Hundreds versus dozens of alerts.
●
All metrics are visualized
Fully automated infrastructure level dashboards, visualizing
all metrics collected.
●
Powerful visualization
Slice and dice any dataset, using controls available on all
charts. No need to learn a query language.
●
Unsupervised anomaly detection
Detects anomalies by learning the behavior of each metric.
●
Out of the box alerts
Predefined alerts use rolling windows and statistical functions
to detect common issues, without fixed thresholds.
From Zero
To Hero
Today!
53
The Netdata way
54
Why Netdata?
We get lost in a sea of
challenges related to
monitoring…
…instead of improving
our infrastructure!
Netdata is an open-source observability platform created by Costa Tsaousis. It enables real-time, high-resolution monitoring with auto-discovery of integrations, unsupervised machine learning for metrics, alerting, visualization, and anomaly detection. With easy installation on any system, Netdata provides detailed insights into various performance metrics and system health, making it a valuable tool for monitoring infrastructure in both cloud and on-premises environments.

Download Presentation

Please find below an Image/Link to download the presentation.
The content on the website is provided AS IS for your information and personal use only. It may not be sold, licensed, or shared on other websites without obtaining consent from the author. Download presentation by click this link. If you encounter any issues during the download, it is possible that the publisher has removed the file from their server.
E N D
Presentation Transcript
Netdata the open-source observability platform everyone needs Costa Tsaousis
2 Page: About Netdata Born out of a need While migrating a large infra from on-prem to cloud, we were facing unexplainable issues - existing monitoring solutions (open-source and commercial) failed to diagnose, or even surface. Born out of curiosity Experimented to understand if and how a monitoring solution could be real-time, high-resolution, easier, simpler and out of the box. Born on GitHub, open-source from the very beginning The love and adoption by the community gave substance and a future to Netdata. GitHub URL:
3 Page: The Netdata way Auto-discover 800+ integrations and k8s autodiscovery supported. Collect Pull and Push model, using the optimal protocol for each application. Netdata is a monitoring in a box Store Embedded high performance time-series database. Learn Unsupervised Machine Learning for every metric. Check Predefined & custom alerts and notifications. Query & Score API for querying, analyzing, scoring and correlating time-series data. Visualize Fully automated dashboards. Stream & Replicate Build metrics centralization points.
4 Page: Netdata on an empty VM 200+ dashboard chars, 2000+ unique time-series CPU, Memory, Disks, Mount Points, Filesystems, Network Interfaces, the whole Networking Stack for all Protocols, Firewall, systemd Units, Processes, Users, User Groups and more. All collected and visualized with 1-second granularity. 50+ unique alerts, on 100+ components Checking the health of every single component the system has, for common errors, misconfigurations, and error conditions. What you get by just installing Netdata on an empty VM systemd-journal logs explorer Visualize the explore system and application logs, by directly querying systemd journals, without the need of logs database server. Network explorer Visually explore all network sockets (to be release this month). Unsupervised anomaly detection 18 Machine Learning models are trained for each time-series collected, modeling the behavior of each metric over the last few days, offering outlier detection in real-time, during data collection. 2 months of retention using 500MB of disk space 3 days of high-res (per-sec), 2 weeks of mid-res (per-min), 2 months of low-res (per-hour). 1% CPU of a single core, 120MB RAM, almost zero disk I/O Optimized for speed and efficiency, a nice companion for production systems and applications.
5 Page: The Netdata way - standalone Install the agent on all your systems. Dashboards Metrics & Logs Alerting Servers S1 S2 S3 S4 S5
6 Page: The Netdata way - distributed fully on-prem Install the agent on all your systems, Use a Netdata Parent for a unified view. Netdata Parent Dashboards Metrics & Logs Alerting S6 Netdata Parent is the same open-source software to all other Netdata. Servers S1 S2 S3 S4 S5 Cloud Provider 1
7 Page: The Netdata way - multi-level Netdata Grandparent Dashboards Metrics & Logs GP Alerting PA PC Netdata Parent Netdata Parent PB Netdata Parent A1 A2 A3 A4 A5 C1 C2 C3 C4 C5 Data Center 1 Data Center 2 B1 B2 B3 B4 B5 Cloud Provider 1
8 Page: Netdata vs Prometheus -35% CPU Utilization Netdata: 1.8 CPU cores per million of metrics/s Prometheus: 2.9 CPU cores per million of metrics/s Stress tested Netdata parent and Prometheus with 500 servers, 40k containers, at 2.7 million metrics/s -49% Peak Memory Consumption Netdata: 49 GIB Prometheus: 89 GiB -12% Bandwidth Netdata: 227 Mbps Prometheus: 257 Mbps -98% Disk I/O Netdata: 3 MiB/s (no reads, 3 MiB/s writes) Prometheus: 129 MiB/s (73.6 MiB/s reads, 55.2 MiB/s writes) -75% Storage Footprint Netdata: 10 days per-sec, 43 days per-min, 467 days per-hour Prometheus: 7 days per-sec :full comparison URL
9 Page: Netdata is the most energy efficient platform! In December 2023, University of Amsterdam published a study related to the impact of monitoring tools for Docker based systems, aiming to answer 2 questions: Netdata outperforms all other monitoring solutions in energy efficiency! 1. What is the impact of monitoring tools on the energy efficiency of Docker-based systems? 2. What is the impact of monitoring tools on the performance of Docker-based systems? They tested ELK, Prometheus, Netdata and Zipkin, under 9 different configurations. This is how Netdata stands: Netdata excels in energy efficiency: "... Netdata being the most energy-efficient tool ...", as the study says. Netdata excels in CPU Usage, RAM Usage and Execution Time. - :full comparison URL -
10 Page: Netdata in CFNF Netdata Netdata is leading the observability category in the CNCF landscape, in terms of users love. 66.9k stars The open-source observability platform everyone needs! Elasticsearch 66.6k stars Free and Open, Distributed, RESTful Search Engine. Grafana 59.1k stars The open and composable observability and data visualization platform. Visualize metrics, logs, and traces from multiple sources like Prometheus, Loki, Elasticsearch, InfluxDB, Postgres and many more. Prometheus 51.6k stars The Prometheus monitoring system and time series database. Jaeger Disclaimer: Netdata is a member of, and supports CNCF, but the project is not endorsed nor incubating in CNCF (because we don t want to). This list indicates only users love, expressed as Github stars. 19.0k stars CNCF Jaeger, a Distributed Tracing Platform.
Netdata Challenge 1: from zero to hero, today!
12 Page: We have a lot in common Similar physical or virtual hardware We all use a finite set of physical and virtual hardware. This hardware may be different in terms of performance and capacity, but the technologies involved are standardized. Since we have so much in common, why it takes so long to set up a monitoring solution? Similar operating systems We all use flavors of a small set of operating systems, exposing a finite set of metrics covering the monitoring of all system components and operating system layers. Packaged applications Most of our infrastructure is based on packaged applications, like web servers, database servers, message brokers, caching servers, etc. Standard libraries Even for our custom applications, we usually rely on packaged libraries that expose telemetry in a finite and predictable way.
13 Page: NIDL, the model for rapid deployment Nodes The node the data are coming from. NIDL stands for: - Nodes - Instances - Dimensions - Labels Contexts The kind of metrics, like disk.io , cgroup.cpu , nginx.requests . Equivalent with the metric name in Prometheus. Instances The unique instances of the things being monitored. For example /dev/sda and /dev/sdb are two instances (disks) for which we monitor disk.io (context). Equivalent of a combination of some of the labels of a metric in Prometheus. Dimensions The attributes of the instances monitored. For example read and write are Dimensions of the disk.io context, of the /dev/sda instance (disk). Dimensions get values and maintain a time-series. Equivalent of a unique time-series in Prometheus. The name comes from the slicing and dicing controls on all Netdata charts.
Page:14 NIDL: how it looks? Every chart on the dashboard is a context, aggregating all the instances from all nodes selected, for the visible timeframe. Dashboard configuration is done per context. Example: apply units to all dimensions, set default dicing settings, provide additional information to help users understand what they see, and more. Context (disk.io) Alerts are configured for contexts, but they are applied to instances. Example: apply this disk.io alert to all disks or even apply this disk.io alert to all NVME disks . Instances have labels, and alert variables related to the component they refer to (for example, disks have a model, a serial number, a kind, etc). Instance (/dev/sda) Instance (/dev/sdb) Instance (/dev/sdc) Variables lookup is smart to match the component the alert is linked to. Dimensions have values, time-series data. read write read write read write
Page:15 NIDL: how it looks? Component 1 /dev/sda Component 2 /dev/sdb Instance (of disk.io) MiB/s Instance (of disk.ops) IOPs Instance (of disk.busy) ms Instance (of disk.io) MiB/s Instance (of disk.ops) IOPs Instance (of disk.busy) ms Common Label Values Common Label Values read write read write busy read write read write busy Common Units, Dimension names, Variable names Common Label names
16 Page: NIDL: the result Netdata incorporates all the knowledge and skills required to set up a monitoring system Fully automated visualization Netdata visualizes all metrics in a meaningful way, by correlating the right dimensions together and applying the right settings for each case. Fully automated alerts Netdata comes with preconfigured alerts for 350 unique components and applications. All these alert templates are applied automatically to the right components, applications and charts. Slice and dice easily from the UI The NIDL framework enables easy slicing and dicing of the data from the UI, without the need to learn a query language.
17 Page: Mission accomplished! Just install it One moving part: Netdata. Batteries included! (i.e. data collection plugins and all needed modules are shipped with Netdata). Auto-discovers all metrics Data collection does not require configuration, unless the monitored data are password protected (Netdata needs the password). Data collection plugins provide metrics with the NIDL framework embedded into them. Designed to be installed mid- crisis! Fully automated visualization Dashboards are available 1 second after Netdata starts. Pre-configured alerts If something is wrong, an alert will fire-up just a few seconds after installation. High Fidelity High granularity: per second data collection and visualization as a standard. High cardinality: the more metrics the better the troubleshooting gets.
Netdata Challenge 2: get rid of the query language for slicing and dicing data
19 Page: Slice and dice from the UI Netdata collects a vast number of metrics you will probably see for the first time Since users haven t configured the metrics themselves, can we provide a UI that can explain what users see? How users will be able to slice and dice the data on any chart, the way it makes sense for them?
Page:20 A Netdata Chart :Netdata Parent URL Netdata Cloud Live Demo URL:
Page:21 Info Button: Help about this chart Info button includes links to relevant documentation and/or some helpful message about the metrics on each chart.
Page:22 A Netdata Chart - controls NIDL Controls - review data sources and slice/filter them (NIDL = Nodes, Instances, Dimensions, Labels) Aggregation across time Aggregation across metrics Dice the data Anomaly rate ribbon Info ribbon
Page:23 A Netdata Chart - anomaly rate per node Similar analysis is available per Instance ( application in this chart), dimensions, and labels. Clicked on Nodes Instances per Node contributing to this chart The visible volume each Node is contributing to this chart The minimum, average and maximum values across all metrics this Node contributes Filter Nodes Unique time-series per Node contributing to this chart The anomaly rate each Node contributes to this chart contributing data to this chart
Page:24 Dicing any chart, without queries Result: dimension,device_type
Page:25 Info Ribbon: Missing data collections A missed data collection is a gap, because something is wrong! Netdata does not smooth out the data.
26 Page: Mission accomplished! The Netdata query engine, does all the calculations, for all drop down menus and ribbons in one go and returns everything in a single query response. All this additional information is available on every query, every chart, every metric! All queries, include all information needed: - - - - - Per Node Per Instance (disk, container, database, etc) Per Dimension Per Label Key Per Label Value Providing: - - - - - Availability of the samples (gaps), over time Min, Average and Maximum values Anomaly Rate for the visible timeframe Volume contributing to the chart Number of Nodes, Instances, Dimensions, Label Keys, Label Values matched
Netdata Challenge 3: make machine learning and anomaly detection useful for observability
28 Page: AI for observability is tricky Google: Wednesday, 2 October, 2019 All of Our ML Ideas Are Bad Todd Underwood, Google The vast majority of proposed production engineering uses of Machine Learning (ML) will never work. They are structurally unsuited to their intended purposes. There are many key problem domains where SREs want to apply ML but most of them do not have the right characteristics to be feasible in the way that we hope. After addressing the most common proposed uses of ML for production engineering and explaining why they won't work, several options will be considered, including approaches to evaluating proposed applications of ML for feasibility. ML cannot solve most of the problems most people want it to, but it can solve some problems. Probably. (and We Should Feel Bad) :URL
29 Page: What does Netdata do with Machine Learning? Trains a ML model per metric, every 3 hours, using the last 6 hours of data of each metric. Default ML Configuration In Netdata Maintains 18 ML models per metric, covering the last few days. Detects anomalies in real-time, while data are being collected every second. All available ML models for a metric need to agree that a collected sample is an outlier, for Netdata to consider it an Anomaly. Stores Anomaly Rate together with collected data. Calculates Host-level Anomaly Score.
30 Page: Netdata s scoring engine A scoring engine, a unique feature across all monitoring systems. Netdata can score all metrics based on their anomaly rate for any given time-frame! All metrics, independently of their context, can be scored across time, based on various parameters, including their anomaly rate. Metrics correlations is a subset of the scoring engine, that can score metrics based on their rate of change (data), anomaly rate of change (anomaly rate), but also based on volume, similarity, and more.
Page:31 A Netdata dashboard One fully automated dashboard, with infinite scrolling, presenting and grouping all metrics available. Quick access to all sections using the index on the right. Multi-dimensional data on every chart, using chart controls to slice and dice any dataset. AI assisting on every step.
Page:32 A Netdata Dashboard - what is anomalous? Anomaly Rate button Time-frame picker Anomaly rate per section for the time-frame
33 Page: Anomaly Advisor Anomaly advisor assists in finding the needle in the haystack. Uses Host Anomaly Rate to identify durations of interest. Host Anomaly Rate is the percentage of the metrics of a host, that were found to be anomalous concurrently. So, 10% host anomaly rate, means that 10% of all the metrics the host exposes, were anomalous at the same time, showing the spread of an anomaly.
Page:34 Anomaly Advisor - starting point Percentage of Host Anomaly Rate Number of metrics concurrently anomalous
Page:35 Anomaly Advisor - triggering the analysis Highlighting an area on the chart, triggers the analysis
Page:36 Anomaly Advisor - the analysis Anomaly advisor presents a sorted list of all metrics, ordered by their anomaly rate, during the highlighted time- frame.
37 Page: Mission accomplished! Netdata turns AI to a consultant that can help you spot what is interesting, what is related, what needs your attention. Unsupervised Anomaly Detection is an advisor! Unsupervised There are plenty of settings, but it just works behind the scenes, learning how metrics behave and providing an anomaly score for them. It is just another attribute for each of your metrics Anomaly Rate is stored in the metrics database together with every sample collected, making it possible to query the past for anomalies. Can detect the spread of an anomaly across systems and applications. Can assist finding the aha! moment while troubleshooting.
Netdata Challenge 4: Make logs exploration and analytics, easy and affordable.
39 Page: Systemd-journald Is available everywhere! We use it already, even when we don t realize it. Is secure by design! FSS, to seal the logs Survives disk failures (uses tmpfs) Its file format is designed for minimal data loss on disk corruption Is unique! Supports any number of fields, even per log entry (think huge cardinality) Indexes all fields provided Queries on any combination of fields Maintenance free - just works! Amazing ingestion performance! systemd-journald is a hidden gem, that already lives in our systems! Can build logs centralization points It provides all the tools and processes to centralize all the logs of an infra to a central place.
Page:40 Netdata systemd-journal Logs Explorer
41 Page: Systemd-journald: it is slow to query Yes and No. The query performance issues are simple implementation glitches, easy to fix. systemd-journal is not slow when used with Netdata We submitted patches to systemd We analyzed journalctl and found several issues that once fixed they improve query performance 14x. We submitted these patches to systemd. Netdata systemd-journal Explorer We managed to bypass all the performance issues systemd- journal has, independently of the version of systemd installed on a system. Netdata is fast when querying systemd-journal logs on all systems, even with a slow systemd-journal and journalctl.
42 Page: Systemd-journald: it lacks integrations Yes it did. Generally, very few tools are available to push structured logs to systemd-journals. The value of a logging system depends on its integrations Netdata log2journal We released log2journal, a powerful command line tool to convert any kind of log into structured systemd-journal entries. Think of it as the equivalent to promtail. For json and logfmt formatted logs, almost zero configuration is needed. Netdata systemd-cat-native We released systemd-cat-native, a tool similar to the standard systemd-cat, which however allows sending a stream of entries formatted in the systemd-journal native format to a local or remote systemd-journald. :URL for log2journal
43 Page: Systemd-journald: key weakness The storage requirements for systemd-journal files are significantly higher than other log management solutions, like Loki. The key weakness of systemd-journald is its storage space requirements So, systemd-journald: - - - - outperforms others in ingestion performance uses significantly less resources during ingestion, is way more secure, reliable and fault tolerant, is the definition of flexibility, supporting any number of fields, in any cardinality, It has a drawback: it needs a lot more disk space for the same data! In our tests: 10 times more. A compressed filesystem can help reduce this to 4 times more.
44 Page: Mission accomplished! Netdata provides the easiest and more efficient way to access your logs, by utilizing resources and tools you already use today. Netdata provides all the tools and dashboards to explore and analyse your system and applications logs, without actually requiring a dedicated logs database server. Despite the storage requirements of systemd-journald, the tool is amazing, especially for developers, since it provides great flexibility and troubleshooting features. Even if you don t want to push your traefik, haproxy or nginx access logs to it due to its storage requirements, we strongly recommend to use it for application error logs and exceptions. Your troubleshooting efforts can become a lot simpler with this environment.
Netdata Challenge 5: Observability is more than metrics, logs and traces. What is missing?
46 Page: Challenge To completely understand or effectively troubleshoot an issue, metrics, logs and traces may not be enough. To completely understand, or effectively troubleshoot an issue, we need more! What if we need to examine: the slow queries on a database, the list of network connections an application has, the files in a filesystem, and the plethora of non-metric, non-log, non- tracing information available? Most monitoring systems give up. You have to use the console of your database server, ssh to the server, or (for others :) restart the problematic component or application and hope the issue goes away Can a monitoring system help?
47 Page: Netdata Functions Netdata Grandparent User is accessing a function exposed by a data collection plugin on B5 GP Alerting PA PC Netdata Parent Netdata Parent PB Netdata Parent A1 A2 A3 A4 A5 C1 C2 C3 C4 C5 Data Center 1 Data Center 2 B1 B2 B3 B4 B5 function plugin Cloud Provider 1
Page:48 Example: Network Connections Explorer
49 Page: Mission accomplished! Data collection plugins expose Functions. Functions have a name, some parameters, accept a payload, return a payload and require some permissions to access them. All these can be custom for each and every function. Functions are data collection plugin features to query non- metric data of any kind Parents are aware of their childrens Functions. Parents are updated in real-time about changes to Functions, so that all nodes involved in a streaming and replication chain are always up to date for the available functions of the entire infra behind them. Dashboards provide the list of Functions. Netdata UI supports widgets for Functions. We are standardizing a set of UI widgets capable of presenting different kinds of data, depending on which is the most appropriate way for them to be presented.
Netdata Monetization Strategy