Understanding Ocean pH Changes Due to Rising CO2 Levels


DATA IN THE CLASSROOM: LEVEL 1
How Does Rising CO
2
Impact Ocean pH?
1.
Calculating Change Over Time:
How much have CO
2
levels in the ocean changed over time? Use the graph to answer
the question.
1.
Make a Prediction:
Observe the graph showing CO
2
measurements at Mauna Loa Observatory, Hawaii, from 1958 to
2018. Then, predict the likely effect of rising CO
2
on ocean pH by completing the table below.
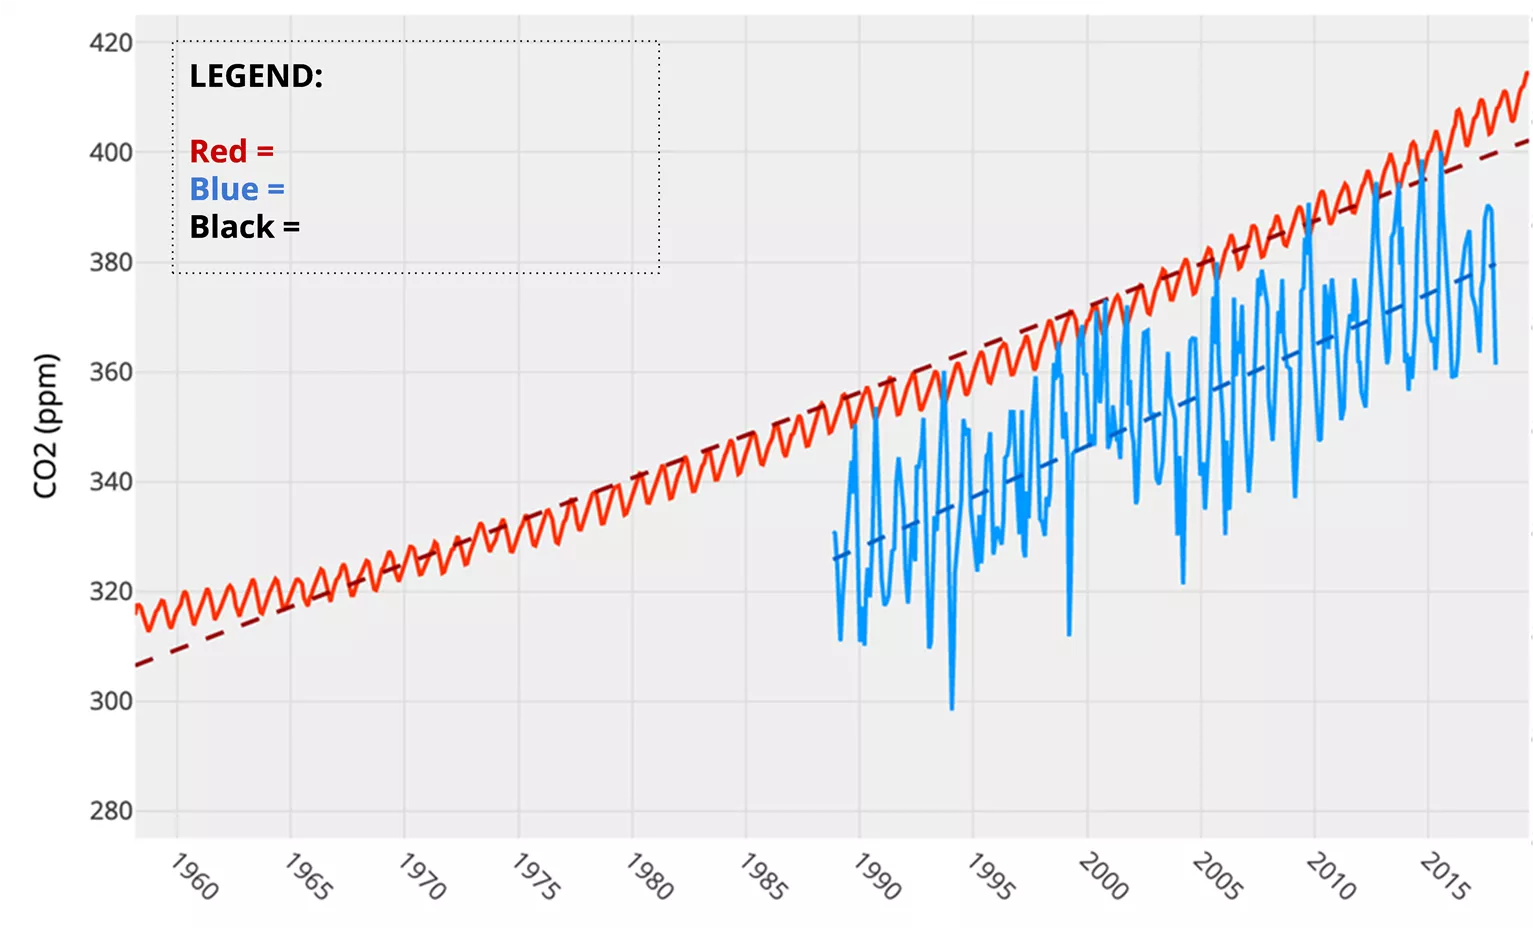
3.
Illustrate Your Prediction:
Illustrate your prediction by drawing a black line on the graph below. See instructions.
a.
Complete the legend (black will represent ocean pH)
b.
Create a pH scale along the y-axis on the right side of the graph.
Note: Do NOT make your scale from 0 to 14. Keep it
centered around your prediction.
c.
Find the year 1988 on the x-axis. Ocean pH was 8.1 in 1988. Place a black dot at this location on the graph.
d.
Starting from the dot, create a line that shows your predicted change in ocean pH from 1988 to current.


Type your
answer directly
into the box.


Type your
answers directly
into the boxes.


Type your
answers directly
into the box.


Type your y-axis values
directly into each of the
rows in the table.


DATA IN THE CLASSROOM: LEVEL 2
Measuring Changes in pH
1.
Predicted vs Actual Change in Ocean pH:
After completing the online activities in Level 2, compare your predictions
from Level 1 with the actual changes in ocean pH.
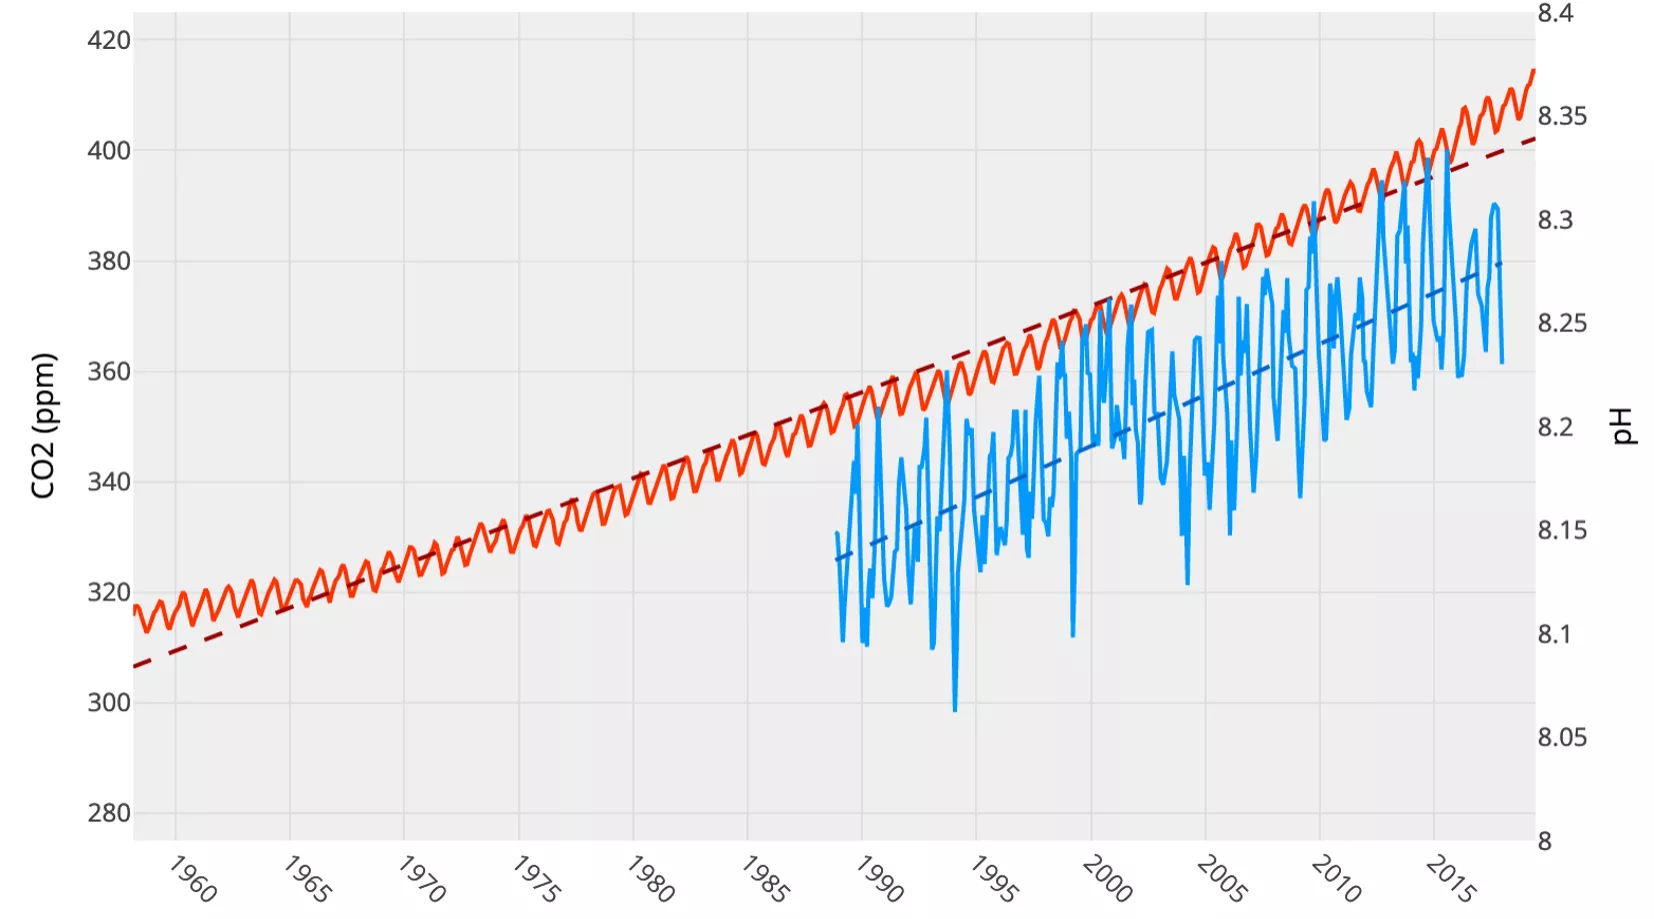
2.
Illustrate the Actual Change in Ocean pH:
Draw a line on the graph to show the actual change in ocean pH over time.
a.
Note: the pH scale along the secondary y-axis is completed for you.
b.
Complete the legend (black will represent ocean pH)
c.
Draw a black trend line on the map to show the long-term trend in ocean pH over time.
3.
Analyzing Short & Long-term Changes in Ocean pH:
How much does ocean pH vary over short and long time scales?


Type your
answer directly
into the box.


Type your
answers directly
into the boxes.


Draw a line to
represent ocean
pH directly on
the graph


Need help?
Refer to Levels 1
and 2 for ideas.


LEGEND:
Red =
Blue =
Black =

DATA IN THE CLASSROOM: LEVEL 3
Examining Acidification Along the Coast
1.
How is acidification different along the coast?
Watch the interactive animation & answer the question below.
1.
Detecting Acidification Near the Coast
: Use the map tool to collect & analyze ocean pH data at two locations, Hawaii
and coastal Washington, between 2010 and 2017. Record below.
3.
Construct an Explanation:
Is ocean acidification is occurring in Washington, in the same way that it is in Hawaii?
Answer the question using the claim, evidence, reasoning table below.
3.
Coastal Acidification:
How would you define coastal acidification? Use your answers in Q1-3 to help form a definition,
in your own words.
Type your
answer directly
into the box.
Type your
answers directly
into the boxes.
Type your
answers directly
into the boxes.
Type your
answers directly
into the box.
DATA IN THE CLASSROOM: LEVEL 4
Acidification’s Impact on Animals
1.
Acidification’s Effect on Shell Building Animals:
Use the online graphic titled ‘Ocean Acidification–What Does it Mean
for Oysters?’ to answer the question below.
1.
How is Acidification Impacting Oysters
? Aragonite saturation state (Ω) is a measurement that describes the tendency
for calcium carbonate to form or to dissolve. What is the relationship between aragonite saturation state, CO2 and pH?
3.
How is Acidification Impacting Oysters
? Complete the table below to show WHEN ocean conditions might negatively
affect the growth and survival of larval Pacific oysters. For each month, write the % of observations that fall below the
threshold (Ω < 1.5 and Ω < 2.0).
Type your
answer directly
into the boxes.
Type your
answers directly
into the boxes.
Type your
answers directly
into the box.
DATA IN THE CLASSROOM: LEVEL 4
Acidification’s Impact on Animals
4.
Construct an Explanation
: Given the current conditions in Washington, will larval oysters have enough aragonite to
grow and build shells? Answer the question using the claim, evidence, reasoning table below.
Type directly
into the boxes.
DATA IN THE CLASSROOM: LEVEL 5
Design an Investigation
1.
Develop Your Question:
Ask a question that can be answered using the data available in Level 5 of the module.
Some sample questions are below.
○
How has water chemistry in the Gulf of Maine been affected by global increases in atmospheric CO2?
○
Does ocean pH in the Gulf of Maine follow the same seasonal pattern as coastal Washington?
○
Do the current conditions in the Gulf of Maine support the growth and survival of the soft-shell clam?
○
In 20, 50 or 100 years, will conditions in the Gulf of Maine be suitable for soft-shelled clams and other shellfish?
1.
Collect Data:
Identify the data that you need to answer your question. If possible, paste or attach your data maps or
charts to this document.
1.
Use the claim, evidence, reasoning format to help answer your question.
Type your
answer directly
into the box.
Type your
answers directly
into the boxes.
Type your
answers directly
into the boxes.
Explore the impact of rising CO2 levels on ocean pH through data analysis, predictions, and comparisons. Learn how to calculate changes over time, predict pH levels, and understand the processes influencing ocean acidification at different locations. Dive into levels ranging from measuring changes in pH to examining acidification along the coast.

Download Presentation

Please find below an Image/Link to download the presentation.
The content on the website is provided AS IS for your information and personal use only. It may not be sold, licensed, or shared on other websites without obtaining consent from the author. Download presentation by click this link. If you encounter any issues during the download, it is possible that the publisher has removed the file from their server.
E N D
Presentation Transcript
DATA IN THE CLASSROOM: LEVEL 1 How Does Rising CO2Impact Ocean pH? 1. Calculating Change Over Time: How much have CO2levels in the ocean changed over time? Use the graph to answer the question. How much has CO2in the ocean increased since 1988? To calculate percent change, find the difference between the starting and ending values, and then divide by the starting value. 1. Make a Prediction: Observe the graph showing CO2measurements at Mauna Loa Observatory, Hawaii, from 1958 to 2018. Then, predict the likely effect of rising CO2on ocean pH by completing the table below. In 1988, the pH of the ocean was approximately 8.1. What do you predict the pH of the ocean is today? Explain why you made your prediction above. Use evidence from the graph (hint: explain how changes in atmospheric CO2and ocean CO2 could have caused pH to change). What are the primary chemical reactions that may explain your predictions? Use chemical equation(s) or words or both. 3. Illustrate Your Prediction: Illustrate your prediction by drawing a black line on the graph below. See instructions. a. Complete the legend (black will represent ocean pH) b. Create a pH scale along the y-axis on the right side of the graph. Note: Do NOT make your scale from 0 to 14. Keep it centered around your prediction. c. Find the year 1988 on the x-axis. Ocean pH was 8.1 in 1988. Place a black dot at this location on the graph. d. Starting from the dot, create a line that shows your predicted change in ocean pH from 1988 to current. Prediction: How Rising CO2 Has Changed Ocean pH (Hawaii) Insert pH scale here LEGEND: Red = Blue = Black = Type your y-axis values directly into each of the rows in the table.
DATA IN THE CLASSROOM: LEVEL 2 Measuring Changes in pH 1. Predicted vs Actual Change in Ocean pH: After completing the online activities in Level 2, compare your predictions from Level 1 with the actual changes in ocean pH. What words or numbers complete the sentences? Type the 2 missing words or values below. My prediction was that pH would [increase or decrease] by pH units. The data show that pH actually [increased or decreased] by ... .. pH units. 2. Illustrate the Actual Change in Ocean pH: Draw a line on the graph to show the actual change in ocean pH over time. a. Note: the pH scale along the secondary y-axis is completed for you. b. Complete the legend (black will represent ocean pH) c. Draw a black trend line on the map to show the long-term trend in ocean pH over time. Measured Change in CO2 and Ocean pH (Hawaii, 1988 - 2017) LEGEND: Red = Blue = Black = 3. Analyzing Short & Long-term Changes in Ocean pH: How much does ocean pH vary over short and long time scales? CO2 and pH both change in a predictable pattern from year to year. Describe the pattern. What causes the predictable pattern? What is ocean acidification? Define the term in your own words.
DATA IN THE CLASSROOM: LEVEL 3 Examining Acidification Along the Coast 1. How is acidification different along the coast? Watch the interactive animation & answer the question below. In addition to the absorption of CO2from the atmosphere, identify and describe TWO processes that can affect ocean pH closer to shore? 1. Detecting Acidification Near the Coast: Use the map tool to collect & analyze ocean pH data at two locations, Hawaii and coastal Washington, between 2010 and 2017. Record below. Location Highest pH value Lowest pH value Range (highest - lowest pH) Cha Ba (Washington) WHOTS (Hawaii) 3. Construct an Explanation: Is ocean acidification is occurring in Washington, in the same way that it is in Hawaii? Answer the question using the claim, evidence, reasoning table below. My Claim: Is ocean acidification is occurring in Washington, in the same way that it is in Hawaii? My Evidence: Include specific data measurements from the graphs & from the table in #2 above. My Reasoning: Connect the evidence to your claim 3. Coastal Acidification: How would you define coastal acidification? Use your answers in Q1-3 to help form a definition, in your own words. My definition for Coastal Acidification
DATA IN THE CLASSROOM: LEVEL 4 Acidification s Impact on Animals 1. Acidification s Effect on Shell Building Animals: Use the online graphic titled Ocean Acidification What Does it Mean for Oysters? to answer the question below. Changes in ocean chemistry reduce the ability of some animals to build their calcium carbonate (CaCO3) shells. Write the chemical reaction(s) to illustrate this statement. Explain the reaction(s) in 1-2 sentences. 1. How is Acidification Impacting Oysters? Aragonite saturation state ( ) is a measurement that describes the tendency for calcium carbonate to form or to dissolve. What is the relationship between aragonite saturation state, CO2 and pH? Write the words that fill in the blanks, below. Word choices: increases, decreases What word(s) complete(s) the sentences below? When CO2 in the atmosphere increases, ocean CO2 .... .. When ocean CO2 .. .. . .., pH ... ...... When pH ...... ......., ... ...... ... 3. How is Acidification Impacting Oysters? Complete the table below to show WHEN ocean conditions might negatively affect the growth and survival of larval Pacific oysters. For each month, write the % of observations that fall below the threshold ( < 1.5 and < 2.0). Aragonite saturation state ( ) Jan (% obs) Feb (% obs) Mar (% obs) Apr (% obs) May (% obs) Jun (% obs) Jul (% obs) Aug (% obs) Sep (% obs) Oct (% obs) Nov (% obs) Dec (% obs) < 1.5 lethal conditions < 2.0 conditions not adequate for growth
DATA IN THE CLASSROOM: LEVEL 4 Acidification s Impact on Animals 4. Construct an Explanation: Given the current conditions in Washington, will larval oysters have enough aragonite to grow and build shells? Answer the question using the claim, evidence, reasoning table below. Given the current conditions in Washington, will larval oysters have enough aragonite to grow and build shells? My Claim: My Evidence: Include specific data measurements from the data table in #3. Describe any patterns that you notice, including seasonal patterns. Connect the evidence to your claim. My Reasoning: Need some help with this section? Consider the following questions. In natural systems, oysters reproduce in the summer months. Will larval oysters be able to build their shells given the current summertime conditions? Could larval oysters experience lethal conditions at any point during the year?
DATA IN THE CLASSROOM: LEVEL 5 Design an Investigation 1. Develop Your Question: Ask a question that can be answered using the data available in Level 5 of the module. Some sample questions are below. How has water chemistry in the Gulf of Maine been affected by global increases in atmospheric CO2? Does ocean pH in the Gulf of Maine follow the same seasonal pattern as coastal Washington? Do the current conditions in the Gulf of Maine support the growth and survival of the soft-shell clam? In 20, 50 or 100 years, will conditions in the Gulf of Maine be suitable for soft-shelled clams and other shellfish? Identify a question of interest about acidification. 1. Collect Data: Identify the data that you need to answer your question. If possible, paste or attach your data maps or charts to this document. Data Example: Gulf of Maine, Ocean pH Date 2010 2015 Map or Graph graph 1. Use the claim, evidence, reasoning format to help answer your question. Claim: Record a simple statement that answers your question and is based upon evidence. Evidence: Include specific data from the the data maps, graphs or charts you have analyzed. Reasoning: Connect the evidence to your claim.