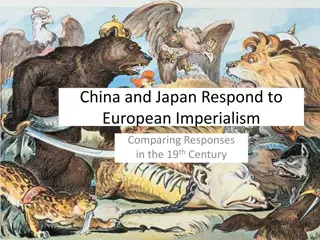
Global Agricultural Trade Trends and the Impact on U.S.-China Relations
Amidst a rollercoaster decade of global trade dynamics, the U.S.-China agricultural trade relationship has faced challenges and fluctuations. From the Great Recession to trade wars and the pandemic, trade patterns have shifted significantly, influencing agricultural trade growth. The presentation discusses the current state of affairs, the multilateral perspective of China's agricultural trade influence, and the headwinds facing U.S. agriculture. It also highlights the recovery of U.S. durable goods spending, indicating a positive trend post-pandemic.

Download Presentation

Please find below an Image/Link to download the presentation.
The content on the website is provided AS IS for your information and personal use only. It may not be sold, licensed, or shared on other websites without obtaining consent from the author. Download presentation by click this link. If you encounter any issues during the download, it is possible that the publisher has removed the file from their server.
E N D
Presentation Transcript
U.S. U.S.- -China Agricultural Trade: China Agricultural Trade: Present State of Affairs Present State of Affairs JASON GRANT PROFESSOR AND DIRECTOR, CENTER FOR AGRICULTURAL TRADE DEPARTMENT OF AGRICULTURAL AND APPLIED ECONOMICS VIRGINIA TECH USDA AGRICULTURAL OUTLOOK FORUM, WASHINGTON, D.C., FEBRUARY 24, 2022 1 - 10/4/2024
Outline Global Trade A Roller Coaster Decade+ (and last 2 years) U.S.-China Agricultural Trade: Where Do We Stand? Multilateral Perspective of China s (growing) Agricultural Trade Influence Conclusions & Headwinds facing U.S. Agriculture 2 - 10/4/2024
A Rollercoaster Decade+ of Global Trade 1. Great Recession: 2008/09 marked largest collapse from very high quarterly growth rates (30% nonag; 20% ag) 2015-2016 Trade slowdown: Commodity prices fell from recent highs; US dollar appreciated; lower global growth forecasts (IMF 2016) 2018/19 Trade War: Significant escalation in applied tariffs; global trade declines only slightly 2020/21 Pandemic: significant decline in nonag trade growth; ag trade growth steady 2021 Recovery: rapid recovery of trade; faster than 08-09 financial crisis; driven (in part) by massive a surge in durable goods spending (and lower spending on services) Quarterly growth in trade (change from same quarter of previous year) 50% Non-agricultural Trade Obama, 1st Term Agricultural Trade Obama, 2nd Term Bush Biden Trump 40% 2. 30% US-China Trade War Falling prices,tariff increases, declining global ag/nonag trade 20% 3. 10% 4. 0% Pandemic Non-ag trade down almost 20%, but quickly recovered Ag-trade positive growth in 2020 -10% 5. 2015/16 Trade Slowdown Non-ag trade down 10% Ag trade down 10% 2008/09 Global Financial Crisis Non-ag trade down 20-25% Ag trade down 10-12% -20% -30% 2005Q1 2005Q2 2005Q3 2005Q4 2006Q1 2006Q2 2006Q3 2006Q4 2007Q1 2007Q2 2007Q3 2007Q4 2008Q1 2008Q2 2008Q3 2008Q4 2009Q1 2009Q2 2009Q3 2009Q4 2010Q1 2010Q2 2010Q3 2010Q4 2011Q1 2011Q2 2011Q3 2011Q4 2012Q1 2012Q2 2012Q3 2012Q4 2013Q1 2013Q2 2013Q3 2013Q4 2014Q1 2014Q2 2014Q3 2014Q4 2015Q1 2015Q2 2015Q3 2015Q4 2016Q1 2016Q2 2016Q3 2016Q4 2017Q1 2017Q2 2017Q3 2017Q4 2018Q1 2018Q2 2018Q3 2018Q4 2019Q1 2019Q2 2019Q3 2019Q4 2020Q1 2020Q2 2020Q3 2020Q4 2021Q1 2021Q2 2021Q3 3 - 10/4/2024
Record Recovery of U.S. Durable Goods Spending Apr 2021 Blue line: durable goods spending Red line: services spending Both lines indexed to February 2020 = 100 Prior to pandemic, durable goods and services rising on similar trend Covid-19 Pandemic: Goods and services exp. declined > 20% of trend through April 2020 By April 2021, however, durable goods expenditure exploded ~ 1.4 times above trend Spending on services has only recently recovered close-to trend Dec 2021 4 - 10/4/2024
Demand Surge and a Global Supply Chain Backlog Global Supply Chain Pressure Index (GSCPI), Source: New York Fed 5.00 4.00 3.00 2.00 1.00 0.00 31-May-2016 30-Nov-2016 31-May-2017 30-Nov-2017 31-May-2018 30-Nov-2018 31-May-2019 30-Nov-2019 31-May-2020 30-Nov-2020 31-May-2021 30-Nov-2021 31-Jan-2016 31-Mar-2016 31-Jan-2017 31-Mar-2017 31-Jan-2018 31-Mar-2018 31-Jan-2019 31-Mar-2019 31-Jan-2020 31-Mar-2020 31-Jan-2021 31-Mar-2021 30-Sep-2016 30-Sep-2017 30-Sep-2018 30-Sep-2019 30-Sep-2020 30-Sep-2021 31-Jul-2016 31-Jul-2017 31-Jul-2018 31-Jul-2019 31-Jul-2020 31-Jul-2021 -1.00 5 - 10/4/2024
China Food Security China Food Security Agritech Co-Innovation Institute Source: South China Morning Post Bread comes first highlights the value Chinese citizens place on food security. China needs to feed 1.4 billion people; 20% of world s population Recent events created more uncertainty around China s food security African swine fever Coronavirus pandemic Increasingly variable climate (2020 floods) China s Ministry of Commerce, Nov. 1, 2021: Families are encouraged to store a certain amount of daily necessities to meet the needs of daily life and emergencies, the ministry said. Reduce food waste Source: South China Morning Post 6 - 10/4/2024
NonAg Imports ($Bil.) NonAg Exports ($Bil.) CHINA Ag Imports ($Bil.) CHINA Ag Exports ($Bil.) $300 $3,000 $250 $2,500 Record*, $205 Bil. $200 $2,000 $150 $1,500 $100 $1,000 2021 Ag. Trade Deficit: $142 Bil. $50 $500 $0 $0 1995 1998 1999 2000 2001 2002 2003 2004 2005 2006 2007 2008 2009 2010 2011 2012 2013 2014 2015 2016 2017 2018 2019 2020 2021 1995 1998 1999 2000 2001 2002 2003 2004 2005 2006 2007 2008 2009 2010 2011 2012 2013 2014 2015 2016 2017 2018 2019 2020 2021 Author s calculations based on Trade Data Monitor, WTO Definition of Agricultural Products Since joining the World Trade Organization (WTO) in 2001, China has become the largest importer of food and agricultural trade. China s Ag. & Total China s Ag. & Total Merchandise Imports, Merchandise Imports, 1995 1995- -2021 2021 The value of China s agricultural imports has risen from $10.3 billion in 2002 to over $200 billion in 2021, representing an average annual growth rate of 16.0%. China s share of global agriculture imports increased from 11% in 2012 to a projected 16% in 2021. China s agricultural exports are just 30% of imports in 2021 resulting in China being the largest net importer of agri-food products. 7 - 10/4/2024
U.S.-China Agricultural Trade 8 - 10/4/2024
U.S. Poultry Exports to China & Taiwan, $ Million U.S. Ag. Exports U.S. Ag. Exports Hampered by On Hampered by On- - Again, Off Again, Off- -Again Trade Again Trade relationship with China relationship with China $1,000 $250 $880 $900 $800 $200 $759 $722 $679 $700 $583 $600 $150 China $500 $427 Taiwan $400 $100 $356 $315 $313 $300 $174 $175 $200 $50 $138 China remains a difficult and unpredictable market for U.S. agricultural exporters, largely because of inconsistent enforcement of regulations and selective intervention in the market by China s regulatory authorities. (USTR, 2021) $100 $49 $47 $36 $33 $10 $0 $0 2005 2006 2007 2008 2009 2010 2011 2012 2013 2014 2015 2016 2017 2018 2019 2020 2021 U.S. Beef exports to China and Korea, $ Million China Korea $2,400 $2,100 $1,800 $1,500 $1,200 $900 $600 $300 $0 2021-Jan-Aug 2001 2002 2003 2004 2005 2006 2007 2008 2009 2010 2011 2012 2013 2014 2015 2016 2017 2018 2019 2020 9 - 10/4/2024
US US- -China Ag Imports, Exports and Trade Balance, $ Million China Ag Imports, Exports and Trade Balance, $ Million $35,000 $30,000 $25,000 $20,000 $15,000 $10,000 $5,000 $0 2010 2021 2000 2001 2002 2003 2004 2005 2006 2007 2008 2009 2011 2012 2013 2014 2015 2016 2017 2018 2019 2020 China Trade Balance Imports Exports In 2018/19, the U.S.-China Trade Relationship Came Under Strain 10 - 10/4/2024
U.S. China Phase One Trade Deal (1) (2) (3) (4) (5) Phase One Product Category 2017 China Imports from U.S. ---------------------------------------------$ Billion------------------------------------------- 2020 Phase 1 Increase 2021 Phase 1 Increase Two-Year Total Purchase Increase Example Products Soybeans, corn, wheat, sorghum, cotton, meat, dairy, seafood, fruit, vegetable, jams, jellies, flour, prepared food Industrial machinery, Electronic equipment, pharmaceutical products, aerospace, vehicles and automotive, optical and medical instruments, iron and steel Agricultural + Seafood $24.1 $12.5 $19.5 $32.0 Manufactured Goods $77.2 $32.9 $44.8 $77.7 Liquified natural gas (LNG), crude oil, refined products Business travel, tourism, financial, insurance, telecom, data, etc. All of the above Energy Products $6.8 $18.5 $33.9 $52.4 Services ------- $12.8 $25.1 $37.9 All Covered Goods ------- $76.7 $123.3 $200 Source: https://ustr.gov/sites/default/files/files/agreement s/phase%20one%20agreement/Phase_One_Agree ment-Ag_Summary_Long_Fact_Sheet.pdf * Note: 2017 uncovered total = $45.1 billion 11 - 10/4/2024
How Did China Facilitate Import Purchases with Retaliatory Tariffs Still in Place? Feb. 2020, China s State Council Customs Tariff Commission issued a 696 list of retaliatory tariff exemptions Exclusions were intended for market-based procurement of commodities Importing firms could begin submitting their applications on March 2, 2020 China s Effective Tariff on Imports from U.S., Inclusive of Retaliation & 696 Exclusions China s Effective Tariff on Imports from U.S., Inclusive of Retaliation & 696 Exclusions Swine Meat, Fzn Pistachios Soybeans Soybean Oil 80% 70% 60% The notice also stated that applications for products not on the list may also be approved China provided subsequent announcements throughout 2020 extending the application deadline on a rolling basis. Tariff Exclusion period 50% 40% 30% 20% 10% 0% Sep-19 Aug-18 Aug-20 Nov-20 Sep-18 Mar-20 20-Jul Sep-20 MFN Apr-20 May-20 Oct-20 Jun-19 Jun-20 Apr-18 Dec-19 Dec-20 Feb-20 Jul-18 12 - 10/4/2024
A Look at Chinas Imports from the U.S. and Competing Suppliers 13 - 10/4/2024
Chinas Agricultural Imports from U.S., Brazil, EU and Australia, 2017-2021 Trade war Phase-One 2021: a record year of values (but not necessarily volumes) China relaxed some non-tariff measures - Beef, poultry, corn exports set new volume records Strong exports, tighter supplies, & rebuilding China s hog herd/feed conversions - Led to a surge in commodity prices - Resulted in the phase one trade deal s ag. purchases looking strong in the 2nd year (2021) - ~ 89% of commitment (83% if using US export statistics (Bown 2022) 14 - 10/4/2024
China Soybean and Corn Imports, 2017-2021 Note: US export statistics: 2020 U.S. soybeans to China: 34.2 mmt 2021 U.S. soybeans to China: 27.4 mmt 15 - 10/4/2024
China Wheat and Beef Imports, 2017-2021 16 - 10/4/2024
U.S. Market Share in China vs. Chinas Imports from U.S. (2021 vs. 2017) 50% Change in US Market Share in China, 2021 vs. 2017 Corn ($5.7 Bil, +43%) 40% Not all products fared well Poultry 30% Fruit, veg., dairy, seafood Other product categories lost market share in China 20% Overall: 10% Beef The size of China s agricultural import pie grew, but the U.S. got a smaller slice Oth Meat Cotton Prods Tobacco Food Prep Nursery WheatProds Chocolate/Confec Oth Oilseed Sheep Sugar FrshVeg 0% Alcohol Coarse Gr. Dairy Misc -$500 $0 CornProds $500 $1,000 $1,500 $2,000 $2,500 $3,000 $3,500 $4,000 $4,500 Soybeans TreeNuts Coff/Tea Pulse ProcVeg Cotton Fruit All AG + Seafood ($14.9 Bil, -2%) Seafood Implication: China is diversifying its portfolio of export suppliers ProcFruit Peanuts SoyProds LiveSwine Wheat -10% Feed/Fodder Pork Cattle/Hides -20% Grain Sorghum -30% 17 - 10/4/2024 Change in Value of China's Imports from U.S. ($ Million), 2021 vs. 2017
Caught in the Crossfire: A Global View of Chinas Growing Market Power Impacts on Agricultural Trade 18 - 10/4/2024
Selected Case Studies Sources: - Global Trade Alert https://www.globaltradealert.org/ - Center for Strategic and International Studies (CSIS) https://www.csis.org/ - WTO SPS Information Management System: http://spsims.wto.org/ - WTO Dispute Settlement Gateway: https://www.wto.org/english/tratop_e/dispu_e/disp u_e.htm - Transcripts of spokesman s remarks Incident Affected Country Timeframe Products Impacted Opening of Taiwan Embassy Lithuania/EU Ongoing Beef, dairy, beer, fish Covid-19 origins (5G technology) Australia 2020-2021 Barley, wine, coal, beef, cotton, sugar Arrest of Huawei CFO Canada 2019-2020 Beef, pork, canola Ban on 5G technology (Huawei) New Zealand (and others) 2019 Certain dairy products Awarding rights prize to Swedish dissident under detention in China Sweden 2019 Prepared fruit/nuts Scarborough Shoal standoff, South China Sea Philippines 2012-2013 Tropical fruit (bananas, pineapples, coconut, etc.) Deployment of U.S. missile defense system Korea 2017 Beverages, spirits, vinegars Hosting Dalai Lama Mongolia 2016-2017 Rapeseed, nuts Nobel Peace Prize awarded to Chinese dissident, Liu Xiaobo Norway 2010-2012 Atlantic Salmon 2010 Senkaku boat collision incident (East China sea) Japan 2010-2011 Rare earth products 19 - 10/4/2024
Chinas Economic China s Economic Influence Can Influence Can Have Significant Have Significant Agricultural Agricultural Trade Impacts Trade Impacts Share of China Barley Imports from Australia, Canada, EU and Ukraine 100% 90% 80% 70% 60% 50% 6.5 mmt 40% 30% 20% 10% 1.3 mmt 0% 2017 2018 2019 2020 2021 AUS CAN EU UKR 20 - 10/4/2024
Conclusions & Headwinds Impacting U.S Agricultural Exports U.S.-China Trade Relationship China is number one market for US, Brazil, Australia, New Zealand, Uruguay, and # 2 market for Canada, EU, Argentina US producers depend on the Chinese market for the sale of their output, just as Chinese consumers depend on U.S. imports for food and feed use (symbiotic relationship) Headwinds US/China elevated tariffs remain will China continue its system of tariff exclusions? China s TRQ compliance issues with (wheat, corn, rice) WTO compliance panel formed August 2021 Geo-political tensions/stability (RUS-UKR; CHN-TWN) Ukraine s most productive agricultural land is located in eastern regions; those regions most vulnerable to a conflict with Russia Food Security: will China s expansion of maize-soybean intercropping reduce its reliance on imports? More Broadly: U.S. needs an FTA Blitz China concluded RCEP and request to join CPTPP EU creating region-to-region FTAs with Mercosur and ASEAN members 21 - 10/4/2024
Thank you! Thank you! Contact Info: Jason Grant, Email: jhgrant@vt.edu | Ph: +1-540-231-7559 Center for Agricultural Trade (CAT) https://aaec.vt.edu/extension/Agricultural-Trade-Center.html 22 - 10/4/2024
Registration (Live and Virtual option): https://vafb.swoogo.com/govag2022 23 - 10/4/2024


")


:")