Math Practice: Ratios, Proportions, Estimation, and Geometric Figures

Explore math concepts such as ratios, proportions, estimation, rounding, and geometric figures through engaging lessons and problem-solving scenarios. Practice using proportions to find missing values, round whole numbers and decimals, estimate costs, and learn about geometric shapes. Enhance your math skills with practical examples and real-life applications.

Download Presentation

Please find below an Image/Link to download the presentation.
The content on the website is provided AS IS for your information and personal use only. It may not be sold, licensed, or shared on other websites without obtaining consent from the author. Download presentation by click this link. If you encounter any issues during the download, it is possible that the publisher has removed the file from their server.
E N D
Presentation Transcript
Spring Break Math Practice Buckle Down Lessons 5, 6, 9, 11, & 13
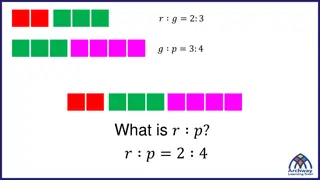
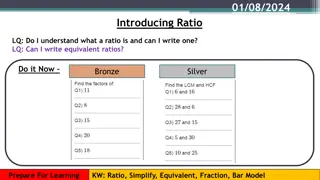
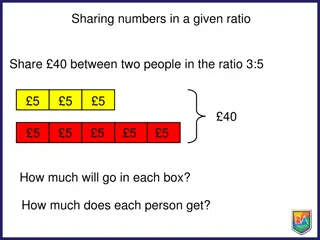
Lesson 5: Ratio & Proportion Ratios can be written in the following ways 6 to 7 6:7 6/7 What is the ratio of butterflies to flowers?
Proportion A proportion compares two different ratios and shows that they are equal. 8 12 2 3 You can use cross products to determine if they are equal.
A proportion can be used to find the missing value in a problem-solving situation. A variable is a letter that can be used to represent the missing value. Pencils are on sale, 3 for 36 cents. How much money does Elysa need to buy 6 pencils? 1. Set up proportion using pencils:money 2. Multiply cross products 3. Solve equation.
Lesson 6: Estimation & Problem Solving
Rounding Whole Numbers & Decimals Look at the digit to the RIGHT of the place to which you are rounding. If the digit is 5 or more, increase the rounding digit by 1 If the digit is less than 5, leave the rounding digit the same Change all digits to the right to zeros Round 7,152 to the following places: Nearest ten: Nearest hundred: Nearest thousand:
Rounding Fractions & Mixed Numbers Round the following to the nearest whole number!
Solve Problems using Estimation Use Reading Strategies!! Agnes and Malcom just moved into a new apartment. They bought a sofa for $826.75, a recliner for $372.54, and a TV for $1,089.67. About how much money did they spend altogether?
Lesson 9: Geometric Figures Please refer to the examples in your packet!
Lesson 11: Measurement Systems
Measuring with Standard Units What is the measure of the line segment to the nearest fraction of an inch?
Estimating with Standard Units What is the measure of the line segment to the nearest centimeter? What is the exact measure of the line segment?
Converting Units of Weight Customary System 9 144 oz =____lb 5 T = ______lb 10,000 40 2.5 lb = ____ oz 1lb = 16 oz 1T = 2,000 lbs
Convert Units of Weight Metric System Kg hg dag g dg cg mg 4 g = ___ mg 3.5 kg = ____mg 2,500mg = ____g 500g = ____kg
Measure of Central Tendency Mean: The sum of the numbers in a data set divided by how many numbers there are in the set. A bookcase has 5 shelves with 38, 42, 47, 36, and 37 books on them. What is the mean number of books per shelf?
Measure of Central Tendency Median: The middle number in a data set arranged from least to greatest. The following list shows the number of customers who ordered pie at Ma and Pa s Diner each day last week. 8, 11, 7, 20, 13, 7, 10 What is the median number of customers who ordered pies?
Measure of Central Tendency Mode: The number that appears most often in a data set. Steve played nine holes of golf and shot the following scores: 4, 5, 4, 6, 3, 7, 4, 5, 4 What is the mode of the scores?
Sampling Sample: A set of data taken from a population (large group) and used to make predictions about the data as a whole. Random Sample: Represents as close as possible the characteristics of the entire population. Biased Sample: Does not represent the entire population. Biased is Bad!
An automotive company wants to find out what feature would lead people to buy a car. Which of the following samples would best represent the entire population? A. Survey people that are not interested in buying a new car. B. Survey 4 students in each 8th grade math class at a middle school. C. Survey every 5th customer that exits a grocery store. D. Survey every 10th customer that just bought a new car.