Analysis of Alloy Performance in Various High-Temperature Conditions
The content provides a detailed analysis of different alloy properties and performance under high-temperature conditions such as carburization, oxidation, and creep. Various figures depict the behavior of alloys in terms of resistance, stress, and rupture. This information is valuable for understanding material behavior in extreme environments.

Download Presentation

Please find below an Image/Link to download the presentation.
The content on the website is provided AS IS for your information and personal use only. It may not be sold, licensed, or shared on other websites without obtaining consent from the author. Download presentation by click this link. If you encounter any issues during the download, it is possible that the publisher has removed the file from their server.
E N D
Presentation Transcript
Figure 2: GRI Study of Alloy Tube Life 35 30 25 Percentage 20 15 10 5 0 0-1 1-2 2-3 3-4 4-5 Tube Life in Years => ~2.5 years
Figure 3: Alloys for Carburizing Service Cast Alloys Wrought Alloys HK 310 HT 330 HU 333 HW 600 HX 602 APM / APMT Slip-Cast SiSiC Si-SiC Composite
Figure 4: Carburization Resistance Weight Gain over 1064 hours @ 1760 F (960 C) 0.60 0.50 0.40 There is a significant difference in alloy performance under Carburizing conditions HK HT HU HW HX mg/mm2 0.30 0.20 0.10 0.00 Alloy
Figure 5: Oxidation Resistance Oxide Penetration 14 12 10 HK HT 8 Most heat treating alloys have reasonably good Oxidation performance at Carburizing temperatures mm/yr HU 6 HW 4 HX 2 0 1832 1922 2012 2102 2204 1000 1050 1100 1150 1207 Temperature F / C
Figure 6: Interpretation of Creep Curves Creep Curves for HT Cast Alloy 10.0 70.0 HT 0.01% / hour HT 0.001% / hour HT 0.0001% / hour 7.5 52.5 CreepStress - MPa Creep Stress - KPSI Rupture @ 10K hrs. Creep increases with applied stress & temperature 5.0 35.0 Rupture at 10K Hours typically coincides with the 0.0001% Creep Stress curve 2.5 17.5 0.0 0.0 1400 1500 1600 1700 1800 1900 2000 2100 2200 760 816 871 927 982 1038 1093 1149 1204 Temperature F / C
Figure 7: Cast Alloy Creep Performance Stress for 0.0001% Creep / Hour 10.0 70.0 HK 0.0001% / hour HT 0.0001% / hour HU 0.0001% / hour HW 0.0001% / hour HX 0.0001% / hour APM 0.0001% / hour APMT 0.0001% / hour Creep Stress - MPa 7.5 52.5 Creep Stress - KPSI 5.0 35.0 Poly. (APMT 0.0001% / hour) 2.5 17.5 0.0 0.0 1400 1500 1600 1700 1800 1900 2000 2100 760 816 871 927 982 1038 1093 1149 Temperature F / C
Figure 8: Alloy Stress to Rupture @ 10K Hours Creep Stress at Temperature 10.0 70.0 Eventually, all metal alloys Creep to failure. Stress and Temperature accelerate the cascade to Rupture. HK 310 HT 330 HU 333 HW 600 HX 602 APMT Creep Stress - MPa Creep Stress - KPSI 7.5 52.5 5.0 35.0 2.5 17.5 Power (310) Power (600) Power (602) Power (APMT) 0.0 0.0 1,000 1,200 1,400 1,600 1,800 2,000 538 649 760 871 982 1,093 Temperature F / C
Figure 9: Alloy Rupture Stress Range Creep Stress to Rupture @ 10K Hours 2.0 14.0 HK 310 HT 330 HU 333 HW 600 HX 602 APMT 1.8 12.6 At 1832 F (1000 C) the Stress Range for 10K Hour Rupture is 500 to 1,600 PSI (3 to 10 MPa). Creep Stress - MPa Creep Stress - KPSI 1.6 11.2 1.4 9.8 1.2 8.4 1.0 7.0 0.8 5.6 0.6 4.2 0.4 2.8 Power (310) Power (600) Power (602) Power (APMT) 0.2 1.4 0.0 0.0 1,700 1,800 1,900 2,000 2,100 927 982 1,038 1,093 1,149 Temperature F / C
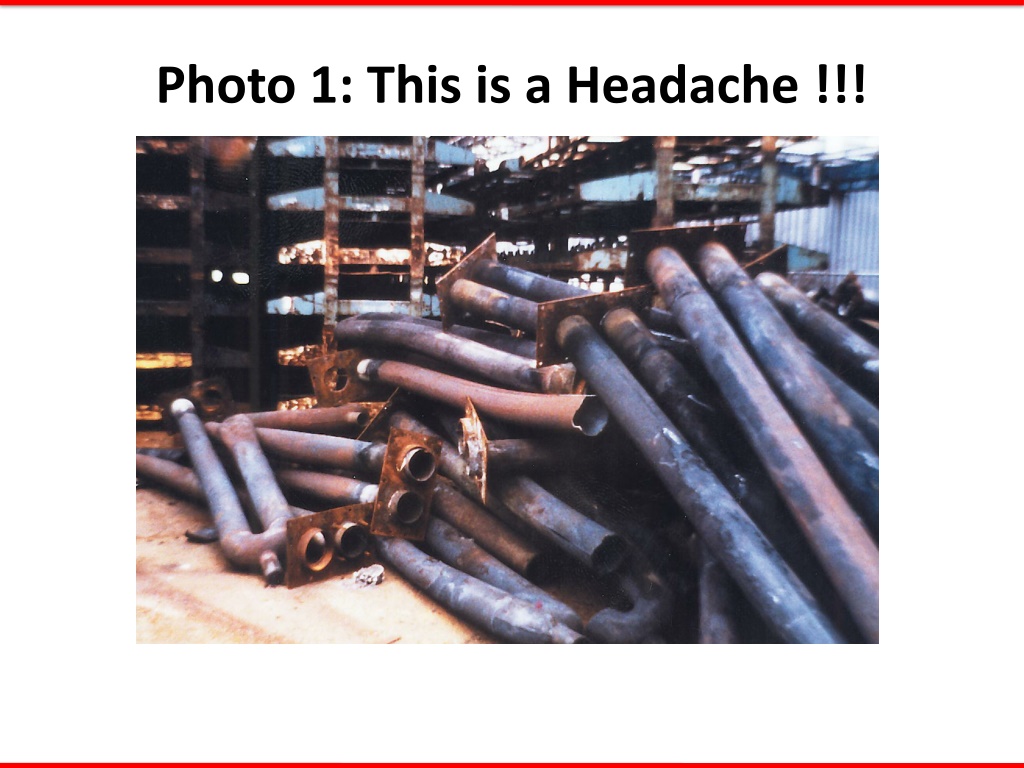
Photo 10: Si-SiC Composite vs. 600 Alloy (after 1 hr.) No deformation for INEX tube tested for 360 hours @ 2462 F (1350 C).
Figure 11: Structural Creep Stress 3 1/4 in. = 83mm Typical Stress for Unloaded Radiant Tubes 3 3/4 in. = 95mm 600 4.2 4 1/2 in. = 114mm 5 1/2 in. = 140mm 6 in. = 152mm 500 3.5 6 3/8 in. = 162mm Simple Beam Stress - Mpa 7 1/2 in. = 191mm Simple Beam Stress - PSI 400 2.8 8 in. = 203mm 3 1/4 in. = 83mm INEX 4 1/2 in. = 114mm INEX 300 2.1 6 in. = 152mm INEX 200 1.4 100 0.7 0 0.0 120 108 96 84 72 60 48 36 24 3.0 2.7 2.4 2.1 1.8 1.5 1.2 0.9 0.6 Tubular Beam Length - inches / meters


")