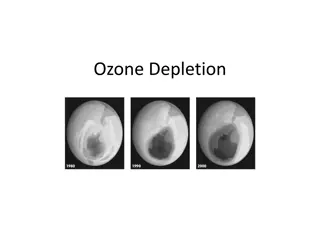
Monitoring Unexpected Emissions of Controlled Substances for Ozone Protection
The atmospheric science community plays a crucial role in identifying, quantifying, and communicating unexpected emissions of controlled substances to support the goals of minimizing future ozone depletion and upholding the Montreal Protocol. By comparing observation-based estimates of global emissions with emission expectations derived from reported production data, scientists can narrow uncertainties and track emissions accurately. Recent studies have noted unexpected emissions post-2012, emphasizing the need for vigilant monitoring and prompt reporting to ensure the integrity of international agreements.

Download Presentation

Please find below an Image/Link to download the presentation.
The content on the website is provided AS IS for your information and personal use only. It may not be sold, licensed, or shared on other websites without obtaining consent from the author. Download presentation by click this link. If you encounter any issues during the download, it is possible that the publisher has removed the file from their server.
E N D
Presentation Transcript
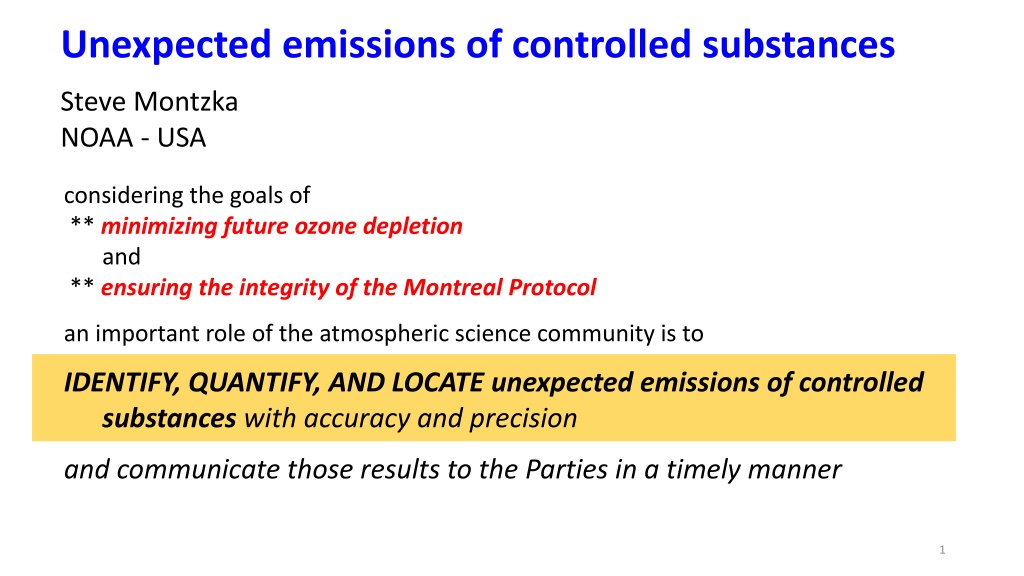
Unexpected emissions of controlled substances Steve Montzka NOAA - USA considering the goals of ** minimizing future ozone depletion and ** ensuring the integrity of the Montreal Protocol an important role of the atmospheric science community is to IDENTIFY, QUANTIFY, AND LOCATE unexpected emissions of controlled substances with accuracy and precision and communicate those results to the Parties in a timely manner 1
Identifying unexpected global emissions: Comparing observation-based emissions to expectations Observation-based estimates of global emissions are: derived from global-scale concentration measurements (NOAA & AGAGE primarily) sensitive to lifetime (affects the scaling of emissions up or down, primarily) historically estimated more reliably as 3 to 5-year averages (transport and loss variability) 2 * Narrowing lifetime uncertainties
Identifying unexpected global emissions: Comparing observation-based emissions to expectations Observation-based estimates of global emissions are: derived from global-scale concentration measurements (NOAA & AGAGE primarily) sensitive to lifetime (affects the scaling of emissions up or down, primarily) estimated more reliably as 3 to 5-year averages historically (transport and loss variability) Emission expectations based on reported production are derived with: extrapolation of inferred bank release rates (WMO Scenarios) - needs a bank estimate, is sensitive to assumed atmospheric lifetime inventory models of production to applications, and application-specific emission factors for all aspects of use and disposal (AFEAS, TEAP, others) statistical analyses including both inventory- and observation-based information (Lickley et al., 2020) 3
Identifying unexpected global emissions: Comparing observationally-derived emissions to scenarios (WMO 2014) 200 200 200 200 200 200 180 180 CFC-11 CFC-12 CFC-113 180 Emission (ODP-kt) 160 160 160 30 140 140 140 Y-axis expanded 120 120 120 25 100 100 * 100 100 100 100 20 80 80 80 15 60 60 60 40 40 40 10 Obs-derived scenario 20 20 20 5 0 0 01990 0 01990 1990 01990 2020 2020 2020 2000 2000 2020 2020 2010 2010 2000 2000 2020 2020 2010 2010 2000 2000 2010 2010 1990 1990 0 1990 2000 2010 Recent difference suggested in Lickley et al. (2021). Recent difference suggested in Lickley et al. (2021). Unexpected emissions noted after 2012; emissions subsequently dropped (Montzka et al. 2018; 2021). The WMO approach implied that CFC-12 banks were minimal by 2012. Is this likely? Difference is small compared to CFC-11 and -12, and is sensitive to the CFC-113 lifetime. Other chemicals of concern: CCl4, perhaps HCFC-141b 2020 values are preliminary 4
The identification and quantification of unexpected emissions are limited by scientific understanding 90 CFC-11 = 50 yr 80 70 Global emissions (Gg yr-1) 60 = 60 yr 50 Uncertain lifetimes yield inexact derived emissions (+/- 10 Gg yr-1 for CFC-11 recently) 40 30 Black = assumes constant transport & mixing Red = incorporates interannual variations in transport & mixing Uncertainties in mixing and transport on year-to-year timeframes can bias emissions average bias ~ 5 Gg yr-1 but as large as 10 Gg yr-1 20 10 2000 2005 2010 year 2015 2020 NOAA & AGAGE data Headway being made since 2018: Ray et al., 2020, Lickley et al., 2021, Ruiz et al., 2021 5
The identification and quantification of unexpected emissions are limited also by Uncertain expectations 90 CFC-11 = 50 yr 80 70 Global emissions (Gg yr-1) 75 60 Relative to the 2008-2012 mean: Cumulative emissions were enhanced by: 75 Gg and 2019 emission is similar to 2008-2012 values = 60 yr 50 40 30 20 10 2000 2005 2010 year 2015 2020 NOAA & AGAGE data 6
The identification and quantification of unexpected emissions are limited also by Uncertain expectations 90 90 CFC-11 = 50 yr 80 80 70 70 Global emissions (Gg yr-1) 60 60 120 Relative to the extrapolated pre-2010 trend: Cumulative emissions were enhanced by 120 Gg and 2019 emissions remain enhanced, by ~10% = 60 yr 50 50 5 40 40 Linear extrapolation from 2002-2012 to 2019 30 30 20 20 10 10 2000 2000 2005 2005 2010 2010 year year 2015 2015 2020 2020 NOAA & AGAGE data (2019 emissions = old bank + new bank + continued activity) 7
The identification and quantification of unexpected emissions are limited also by Uncertain expectations 90 90 90 90 CFC-11 = 50 yr 80 80 80 80 70 70 70 70 Global emissions (Gg yr-1) 60 60 60 60 Relative to the upper limit lifetime and upper limit expectation from TEAP (2019) model: Cumulative emissions were enhanced by 175 Gg and 2019 emissions remain enhanced, by ~30 Gg = 60 yr 175 50 50 50 50 40 40 40 40 30 Linear extrapolation from 2002-2012 to 2019 expectation 30 30 30 30 Lickley et al. 2020 TEAP (2019) inventory model 20 20 20 20 10 10 10 10 2000 2000 2000 2000 2005 2005 2005 2005 2010 2010 2010 2010 year year year year 2015 2015 2015 2015 2020 2020 2020 2020 NOAA & AGAGE data (2019 emissions = old bank + new bank + continued activity 8
The identification and quantification of unexpected emissions are limited also by Uncertain expectations 90 90 90 90 CFC-11 = 50 yr 80 80 80 80 70 70 70 70 Global emissions (Gg yr-1) 60 60 60 60 Relative to the lower limit lifetime and lower limit expectation from TEAP (2019) model: Cumulative emissions were enhanced by 440 Gg and 2019 emissions remain enhanced, by ~40 Gg = 60 yr 440 50 50 50 50 40 40 40 40 Linear extrapolation from 2002-2012 to 2019 expectation 30 30 30 30 40 Lickley et al. 2020 TEAP (2019) inventory model 20 20 20 20 10 10 10 10 The updated TEAP (2021) model analysis suggests: The discrepancy starts in 2007 Similar cumulative emission totals A smaller discrepancy in 2019 (15-30 Gg) 2000 2000 2000 2000 2005 2005 2005 2005 2010 2010 2010 2010 year year year year 2015 2015 2015 2015 2020 2020 2020 2020 NOAA & AGAGE data 9
Locating the regions responsible for the unexpected emission: --Remote station measurements contain information about regional emissions but they lack geographic and quantitative precision e.g., Montzka et al. (2018) suggested some of global emission increase was from eastern Asia Shaded regions indicate those areas where emissions currently can be quantified on regional scales --Non-remote stations can provide quantitative measures of regional emission distributions and magnitudes (e.g., Rigby et al., 2019; Park et al., 2021) xx --gaps in the network limit our ability to attribute global changes to specific regions (e.g., only 60 30% of the global CFC-11 emission increase was attributable to a specific region, eastern China) Given the existing network 10
Conclusions: Unexpected emissions have been identified for some controlled chemicals (CFCs, CCl4, others?) After a problem was identified for CFC-11 in 2018, emissions dropped sharply by 2019 but we can t say that the issue has been resolved by 2019 (or 2020) ozone impact likely will be minor, but isn t yet well constrained Rapid identification and quantitative estimates of unexpected emissions are limited by: * Uncertainties in trace-gas lifetimes and * Uncertainties in transport and mixing processes * Uncertain expectations of emissions given MP controls Emissions derived from remote station observations capture emissions wherever they occur, * but actionable regional-scale information is provided only by observations nearby Gaps in the observational network limit our knowledge of emissions in many regions * there are multiple technical approaches for filling those gaps (flasks, on-site instruments, periodic surveys) 11
END 12
Quantifying the unexpected emissions and their impact Thin blue lines = TEAP (2019) inventory model 90 90 90 Cumulative unexpected emission depends on the expectations: 80 80 80 70 70 70 a) Constant over time emission (Gg yr-1) emission (Gg yr-1) emission (Gg yr-1) 60 60 60 b) Linear extrapolation from 2002-2012 120 Gg Problem nearly eliminated? c) Statistical model (Lickley et al., 2020) Also ~120? d) TEAP inventory model (TEAP 2019) Xx to 440 50 50 50 40 40 40 30 30 30 20 20 20 10 10 10 2000 2000 2000 2005 2005 2005 2010 year year year 2015 2015 2015 2020 2020 2020 2010 2010 13