Understanding Decomposition: Experiments & Predictions for Students
Engage students in understanding decomposition through hands-on experiments, predictions based on factors, and analysis of data. Explore various decomposition examples, set up experiments with different variables, and analyze outcomes to enhance comprehension. Utilize resources like LIDET graphs and real-world decomposition studies to deepen understanding of factors affecting decomposition processes.

Download Presentation

Please find below an Image/Link to download the presentation.
The content on the website is provided AS IS for your information and personal use only. It may not be sold, licensed, or shared on other websites without obtaining consent from the author. Download presentation by click this link. If you encounter any issues during the download, it is possible that the publisher has removed the file from their server.
E N D
Presentation Transcript
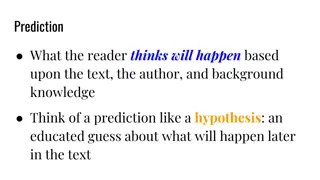
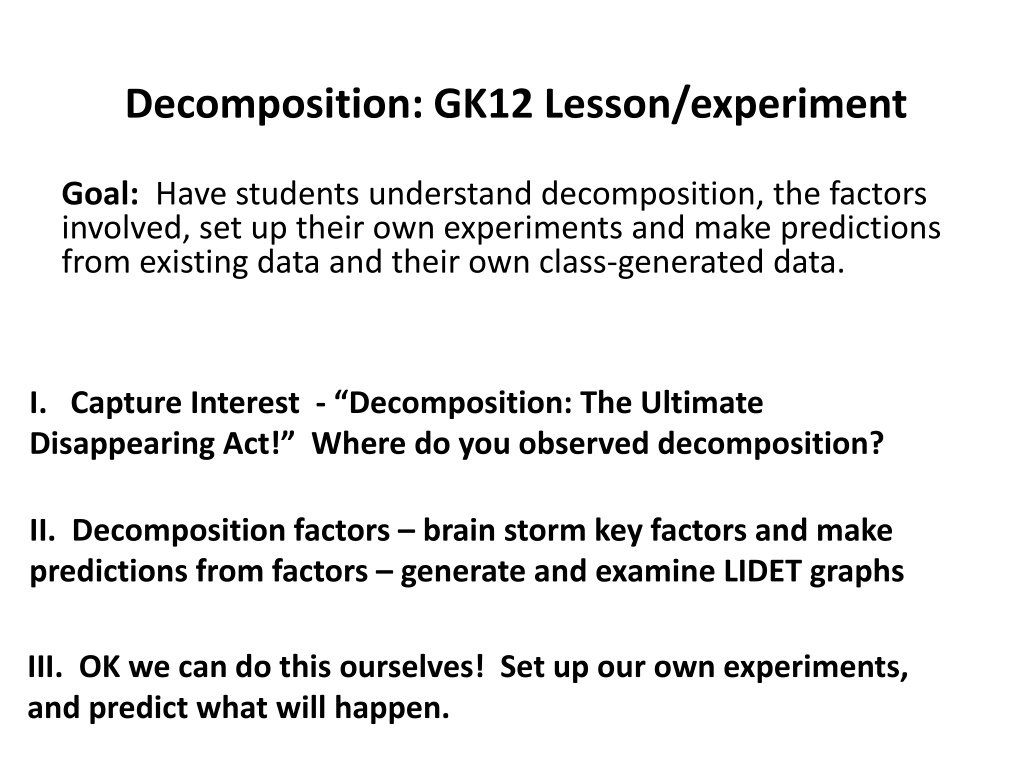
Decomposition: GK12 Lesson/experiment Goal: Have students understand decomposition, the factors involved, set up their own experiments and make predictions from existing data and their own class-generated data. I. Capture Interest - Decomposition: The Ultimate Disappearing Act! Where do you observed decomposition? II. Decomposition factors brain storm key factors and make predictions from factors generate and examine LIDET graphs III. OK we can do this ourselves! Set up our own experiments, and predict what will happen.
Decomposition Decomposition Lots of options also bring in some examples Pig https://www.youtube.com/watch?v=R1CD6gNmhr0 Fruit Bowl https://www.youtube.com/watch?v=c0En-_BVbGc
What happened to the soil level after the swamp was drained in 1927?
Decomposition experiments! What are our dependent and independent variables? Pick your sample apple, gummi bear, etc OR Pick your temp fridge, outdoors etc OR Pick soil compost versus sand.
Take outdoors! Make litter bags Take same approach as Petri dish, but (mass loss), but make a bag for each time point and remove over time. Construct a similar graph Use LIDET as a resource (link on sheets) http://andrewsforest.oregonstate.ed u/research/intersite/lidet.htm
Decomposition in action LIDET experiment from the LTER network http://andrewsforest.oregonstate.edu/research/intersite/lidet.htm Same litter, different climate The same litter was placed in three different locations: Alaska, temperate forest (like Michigan!) and Puerto Rico. Can students predict which line belongs to what location? How to the lines differ? How to the lines look in year 1? What about in year 8? What do you think happened to the bottom line after year 4?
Decomposition in action LIDET experiment from the LTER network http://andrewsforest.oregonstate.edu/research/intersite/lidet.htm Different litter, same climate! Two types of litter leaves from a fruit tree and needles from a pine tree! Can students predict which line belongs to what plant? Why is there a differences? What do you think happens with these different litters in different climates?
Basic Berlese funnel! This is the cheap version, to extract mesofauna from soil.
Bromothymol Blue CO2 driven pH change
April, 2014 Canada Blue Whale http://www.theguardian.com/environment/video/2014/apr/30/rotting- dead-whale-verge-exploding-canada-video Whale fall https://www.youtube.com/watch?v=rdI3eFrTGs8