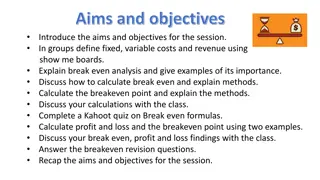
Understanding Break-Even Analysis and CVP Formulas


B
r
e
a
k
-
E
v
e
n
A
n
a
l
y
s
i
s
Chapter Content
B
r
e
a
k
-
E
v
e
n
A
n
a
l
y
s
i
s
F
o
r
m
u
l
a
e
L
i
m
i
t
a
t
i
o
n
s
M
u
l
t
i
-
p
r
o
d
u
c
t
Breakeven Revenue: C/S Ratio
BEP
(In $)
Fixed Costs
C/S
Ratio
Total Contribution
=
=
=
Contribution/Unit
Sales Price/Unit
C/S Ratio
Total Sales Revenue
Margin of safety = Budgeted level of activity – Breakeven level of activity
Margin of safety (%) =
100%
Budgeted Level of Activity – Breakeven level of activity
Budgeted level of activity
Example..
Example..
A break down of KP's profit in the last accounting period showed the following:
$000
Sales
450
Variable costs
(220)
Fixed costs
(160)
––––
Profit
70
––––
Due to a downturn in market conditions the company is worried that next year may
result in losses and would like to know the change in sales that would make this
happen.
Required:
The percentage fall in sales that would be necessary before the
company would begin to incur losses is ____% (work to two decimal places).
C/S Ratio
Multi-Product CVP Formulae
BE Point
(Revenue)
=
Fixed Costs
Required
Revenue
=
Weighted Average C/S Ratio
Weighted Average C/S Ratio
Fixed Costs
+ Required Profit
Example.. Weighted average C/S ratio
A company sells three different levels of TV maintenance contract to its
customers: Basic, Standard and Advanced. Selling prices, unit costs and
monthly sales are as follows:
Basic
Standard
Advanced
£
£
£
Selling price
50
100
135
Variable cost
30
50
65
Monthly contracts sold
750
450
300
(a) Calculate the average contribution to sales ratio of the company based on
the sales mix stated above.
(b) Calculate the average contribution to sales ratio of the company if the total
number of monthly contracts sold remains the same, but equal numbers of
each contract are sold.
Break-even charts
Profit-volume chart
Multi-product profit chart
Limitations of CVP Analysis
•
Linearity of total cost and total revenue
•
All costs can be divided into fixed and variable elements
•
Efficiency and productivity are unchanged
•
The sales mix is maintained as total volume changes
•
Constant price
•
Constant variable cost per unit
•
Constant contribution
•
Constant fixed costs
Dive into the world of break-even analysis and cost-volume-profit formulas to analyze business profitability. Learn about breakeven revenue, contribution/sales ratio, weighted average C/S ratio, and more through practical examples. Explore the significance of break-even charts and profit-volume charts in making informed financial decisions.

Download Presentation

Please find below an Image/Link to download the presentation.
The content on the website is provided AS IS for your information and personal use only. It may not be sold, licensed, or shared on other websites without obtaining consent from the author. Download presentation by click this link. If you encounter any issues during the download, it is possible that the publisher has removed the file from their server.
E N D
Presentation Transcript
11 Session Break-Even Analysis
Chapter Content Break-Even Analysis Multi- product Formulae Limitations
Breakeven Revenue: C/S Ratio Contribution/Unit Sales Price/Unit Total Contribution Total Sales Revenue C/S Ratio = = Fixed Costs C/S Ratio BEP(In $) = Margin of safety = Budgeted level of activity Breakeven level of activity Budgeted Level of Activity Breakeven level of activity Margin of safety (%) = 100% Budgeted level of activity
Example.. A break down of KP's profit in the last accounting period showed the following: $000 Sales 450 Variable costs (220) Fixed costs (160) Profit 70 Due to a downturn in market conditions the company is worried that next year may result in losses and would like to know the change in sales that would make this happen. Required: The percentage fall in sales that would be necessary before the company would begin to incur losses is ____% (work to two decimal places).
Multi-Product CVP Formulae Fixed Costs BE Point (Revenue) = C/S Ratio Weighted Average C/S Ratio Fixed Costs + Required Profit Required Revenue = Weighted Average C/S Ratio
Example.. Weighted average C/S ratio A company sells three different levels of TV maintenance contract to its customers: Basic, Standard and Advanced. Selling prices, unit costs and monthly sales are as follows: Selling price Variable cost Monthly contracts sold Basic 50 30 750 Standard 100 50 450 Advanced 135 65 300 (a) Calculate the average contribution to sales ratio of the company based on the sales mix stated above. (b) Calculate the average contribution to sales ratio of the company if the total number of monthly contracts sold remains the same, but equal numbers of each contract are sold.
Limitations of CVP Analysis Linearity of total cost and total revenue All costs can be divided into fixed and variable elements Efficiency and productivity are unchanged The sales mix is maintained as total volume changes Constant price Constant variable cost per unit Constant contribution Constant fixed costs