Economic and Financial Development of Croatia During and After the War
Experience and lessons from the Croatian War of Independence, including impacts on economic growth, banking sector reforms, inflation control, and monetary policy framework. The war, lasting from 1991 to 1995, resulted in significant casualties, territorial losses, and economic damages, with Croatia undergoing structural changes to stabilize and rebuild its economy post-conflict.

Download Presentation

Please find below an Image/Link to download the presentation.
The content on the website is provided AS IS for your information and personal use only. It may not be sold, licensed, or shared on other websites without obtaining consent from the author. Download presentation by click this link. If you encounter any issues during the download, it is possible that the publisher has removed the file from their server.
E N D
Presentation Transcript
1 NB of Ukraine-NB of Poland 2023, Annual Research Conference June 23, Krakow Croatian Experience and Lessons of Economic and Financial Development During and After the War Boris Vujcic Governor Croatian National Bank
2 Overview The Croatian War of Independence The Impact of War on Economic Growth Structural Reforms in the Banking Sector after the War Stopping High Inflation and Reforming Monetary Policy Framework During and in the Aftermath of the War
3 The Croatian War of Independence Separation from The Socialist Federal Republic of Yugoslavia April and May, 1990 - The first multi-party democratic elections o December 22, 1990 The Croatian Parliament adopted the Constitution of the Republic of Croatia ( The Christmas constitution ) o June 25, 1991 - Independence from the SFRY o
4 The Croatian War of Independence War lasted from 1991 to 1995 1991: The first armed conflct was the Pakrac clash (March 1), followed by The Plitvice Bloody Easter (March 31) o 1995: The last major combat operation was Operation Storm (August 5-8,1995). o Formally, the war ended by signing the Erdut Agreement (November 15, 1995). o August 5th: Victory and Homeland Thanksgiving Day and the Day of Croatian Defenders
5 The Croatian War of Independence There were about 16 thousand killed (of whom 43.4% were civilians), and about 35 thousand wounded people on the Croatian side. Out of 4,4 million population 0.4% died, 0.8% were wounded. o 14,760 km2 (26%) of the Croatian territory was under occupation. More than half (54%) of total territory inhabited by 36% of total population suffered war damages. Up to 300,000 Croats were displaced, while total number of displaced persons including refugees from B&H peaked at about half a million. 15% of housing units and 2,423 cultural heritage structures, including 495 sacral structures, were destroyed or damaged. Total war damages were estimated (in 1999) at around 31 billion euro (around 150% of Croatia s 1990 GDP).
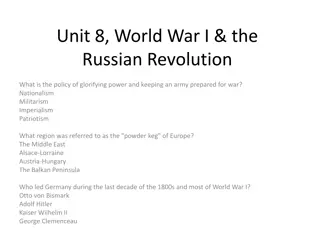
Croatia had five arrangements with the IMF, but used very little money, overall, up until the EU entry, inflow of official funds was modest 6 IMF Lending comitments, in thousands of SDRs Source: IMF
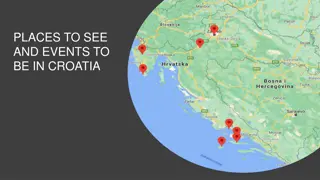
7 Croatia s international integration since independence
8 The Impact of the War on Economic Growth While war results in destruction of lives and property, economic growth tends to strongly recover in the aftermath of the war According to the neoclassical theory, the positive effect of war on economic growth can be achieved through different channels: 1) Investment growth: phoenix factor (Organski& Kugler,1977) 2) Technological progress 3) Increase in the savings rate
9 ... reasons for positive relationship between war and economic growth after the war The war can destroy networks of old political and economic interest groups that limited growth by protecting their partial interests at the expense of the public one (Olson, 1982). Positive impact of war on human capital because better management and organizational skills are acquired (Dulles, 1942). Removal of trade restrictions and increase of international cooperation after the war (as for example after the World War II).
10 "Phoenix factor" case of Germany, Japan and Croatia Germany Japan Croatia Cumulative GDP decline in the war years, % -61,2 -45,1 -32,5 Average GDP growth rate in the war years, % -10,8 -9,0 -10,9 Average GDP growth rate in the post-war reconstruction, % 11,3 6,3 6,1 Duration of post-war recovery, number of years 9 10 9 Note: The data refer to GDP per capita, 2011 prices. War years for Germany refers to period from 1941 to 1946, for Japan from 1942 to 1946, and for Croatia from 1990 to 1993. Source: Maddison Project Database (MPD) 2020, CNB calculation
11 Economic growth slowed-down substantially after the disappearance of the "phoenix factor" Average growth rates of GDP per capita Note: PEER countries refer to Bulgaria, Czech Republic, Estonia, Hungary, Lithuania, Latvia, Poland, Romania, Slovakia and Slovenia. Source: Maddison Project Database (MPD) 2020,Ameco, CNB calculation.
12 Main reasons for a relative slowdown in 2002-2013 period No EU integration, significant disadvantage to the Peer group of countries - diversion of trade and investments Low labour force participation compared to the peers (large share of disability pensions and war veterans, most of whom were working age population but retired) 25 p.p higher public debt compared to the peer group of countries, mainly as a result of war State owned companies and general government too large and inefficient Lack of significant structural reforms (product and labor market reforms)
13 ... resulting in a relatively poor business environment Doing Business Global Competitiveness Index Note: Ranking higher score means worse position. PEER countries refer to Bulgaria, Czech Republic, Estonia, Hungary, Lithuania, Latvia, Poland, Romania, Slovakia and Slovenia. Source: World Bank, Doing Business 2015 Note: Ranking higher score means worse position. Source: World Economic Forum, Global Competitiveness Report 2014-2015
14 Structural Reforms in the Banking Sector after the War 1) Legacy issues in the banking sector dating back to socialist Yugoslavia 2) Why structural reforms in the banking sector are needed after the war? 3) Bank rehabilitation in 1991/1992 4) Subsequent rehabilitations and privatization of banks
15 1) Legacy issues in the banking sector dating back to socialist Yugoslavia Before the war, the banking system was exposed to serious operational difficulties, with a large number of insolvent banks. Croatian National Bank noted the following in its 1991 Annual Report: At the end of 1990 ... five banks were solvent, ten banks were solvent with problems related to the settlement of claims, eleven banks were technically insolvent and two banks were seriously technically insolvent. Accordingly, prior to the war, 13 out of a total of 28 banks were insolvent. Therefore, in 1990s the Croatian National Bank was trying to forge a political consensus for rehabilitation and restructuring of banks.
16 2) Why structural reforms in the banking sector were needed after the war? Many bank clients are negatively affected by the war, some clients may cease to exist or temporarily go out of business. In such a context it is likely that some claims can never be recovered, or that they can be recovered only after a long period of time. Large share of such problem assets tend to increase lending interest rates that also hit clients not directly affected by the war. Structural reforms should aim to limit spillovers from bad to good assets.
17 3) In 1991 and 1992 government issued bonds for rehabilitation of banks "Big bonds" indexed to producer prices o Recapitalization of failed state owned enterprises, which used bonds to repay debts o Issued in November 1991 in amount of 1 billion USD (6% of 1991 GDP), for a period of 20 years, they were almost 15% of the banks' total exposure to companies Bonds in foreign currency o Turning household FX deposits into public debt in December 1991 o 3 billion USD (19% of 1991 GDP) repaid in 20 half-yearly instalments, starting in 1995, with 5% interest Above bonds replaced about 50 per cent of total bank assets and improved the quality of banks assets: o Positive impact of big bonds on banks' asset quality and capital adequacy was much higher than expected. Bonds were indexed to inflation, while the value of other assets and liabilities in domestic currency declined rapidly in real terms because of high and rising inflation. o Bonds in foreign currency replaced claims in foreign currency on the National Bank of Yugoslavia (NBY) in banks' balance sheet that became worthless after the breakup of Yugoslavia. Bonds solved solvency but not liquidity problems of banks.
18 4) Subsequent rehabilitation and privatization of banks Bank rehabilitation operations assured bank solvency and minimum capital, but their negative by-product was: o state-owned banks mostly continued accumulating losses, largely due to further cumulation of non-performing placements to big state-owned enterprises with operational problems; o significant changes did not occur in banks business models. Banks that previously cumulated losses continued to operate poorly. In 1996, three out of four biggest banks were again in the need of rehabilitation. Largest one was not because it was mostly retail bank.
19 4) Subsequent rehabilitations and privatization of banks (continued) Rehabilitation oh three large state own banks was on case-by-case basis and involved: 1) Bank equity has been written-down 2) Banks were downsized and recapitalized by government 3) Bank management was replaced After rehabilitation interest rates declined strongly. But, two sets of bank rehabilitation,during and after the war have increased public debt above the level in peer group of transition economies
20 4) Subsequent rehabilitation and privatization of banks (continued) Overnight interest rate on the intrabank market Interest rates for short-term borrowing on the money market fell from 26.3 percent in the second quarter to 11.4 percent in the third quarter of 1996. After this one-time adjustment, a general decline continued and in the fourth quarter of 1997 reached the level of 8.9 percent. Source: Croatian National Bank
21 Stopping High Inflation and Reforming Monetary Policy Framework During and After the War 1) Macroeconomic context at the beginning of 1990s 2) Anti-inflationary/stabilization program during the war, in October 1993 3) Monetary policy in the aftermath of the war 4) Macroprudential measures and boom bust cycle in 2000s
22 1) Macroeconomic context at the beginning of 1990s Temporary currency issued by the government was in circulation from 1992 to 1994 Very high and increasing inflation, currency was not convertible No international reserves and foreign debt in default Huge capital outflows prior to the war, followed by secular inflows after the independence Croatia was not a member of international financial institutions no external help
23 1) Macroeconomic context at the beginning of 1990s (continued) Central bank policy: a) Without international reserves only available option for the exchange rate regime was the full flexibility of the exchange rate. The central bank reform priority was to develop foreign exchange market in Croatia. High inflation was coupled with strong nominal deprecation. b) c)
24 2) Anti-inflationary program in October 1993 Inflation was mostly caused by deeply rooted inflationary expectations that were fueled by fast nominal exchange rate depreciation. The key element of the program was to break the depreciation expectations. Ceiling for the HRK/DEM exchange rate was announced in October 1993 following an initial one-off devaluation (23%). After the announcement, the exchange rate started to appreciate strongly and by the end of November 1994 it had returned to the level where it was immediately before the announcement of the program i.e. before the one-off devaluation. The strong appreciation of the exchange rate quickly curbed inflationary expectations and inflation. The credibility of the program was further reinforced by full external convertibility of currency that was proclaimed at the end of May 1995.
25 2) Anti-inflationary program in October 1993 (continued) Exchange rate eur/hrk Source: Croatian National Bank
26 Successful stabilization program in 1993 after couple of bouts of hyperinflation before and during the war/start of the transition Consumer price index (1981-1993) Consumer price index (1994-2022) Note: Data refer to end-of-period data for December. Source: Croatian National Bank Note: Data refer to end-of-period data for December. Long-term average refers to period from 1996 to 2022. Source: Croatian National Bank
27 3) Monetary policy in the aftermath of the war High euroization and memory of huge exchange rate depreciation required strong containment of FX volatility, but exchange rate was never fixed in order not to provide one-way bet for the markets. Monetary policy was based on the exchange rate anchor, and managed floating of exchange rate replaced free floating that existed at the beginning of 1990s. The central bank also had to build international reserves. o Currency was exposed to appreciation pressures due to capital inflows, so this was easy to do. o International reserves for most of the subsequent period exceeded 99% of central bank assets. The exchange rate channel was used to control inflation. o While central bank contained short-term exchange rate fluctuations by intervening in the foreign exchange market, exchange rate would gradually adjust over the longer horizon. o In case of large capital inflows and overheating, the central bank would allow for a moderate appreciation.
28 4) Macroprudential measures and boom bust cycle in 2000s In 2000s, Croatia experienced lending boom on the back of gradual financial integration. In search for a profit and market share banks turned to foreign (mother) sources of financing, amid extremely favourable financing conditions and high liquidity at the global level. Clear signs of overheating of the economy were the rapid credit growth, an unsustainable current account deficit (close to 10 percent of GDP), a leap in the external debt and indications of price bubbles in the real estate and securities markets. In the period of large capital inflows, raising central bank interest rates to tame the business cycle was not the policy option due to the risk of exacerbating capital inflows event further. Therefore, in the period from 2003 to 2007, the CNB implemented a range of measures to limit excessive lending mainly additional liquidity and capital requirements. Later, these measures were labeled - the macroprudential policy toolkit.
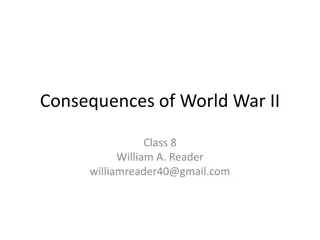
Macro-prudential measures were introduced early and expanded gradually ... Compulsory CNB Bills 35 Marginal Reserve Requirement 30 New Decision on the Capital Adequacy 25 Compulsory CNB Bills 20 % 15 10 5 0 -5 3/11 6/11 9/11 12/01 12/03 12/06 12/08 12/10 12/02 12/04 12/05 12/07 12/09 12/11 3/02 9/02 6/03 3/04 9/04 6/05 3/06 9/06 6/07 3/08 6/09 9/09 3/10 3/12 6/02 3/04 9/03 6/04 3/05 9/05 6/06 3/07 9/07 6/08 9/08 3/09 6/10 9/10 Credit growth (year on year) Source: CNB.
... while instruments were progressively tightened. 45 55% 40 Abolished in October 2008 35 30 in billion HRK 25 40% 20 30% 15 24% 10 5 0 8/04 11/04 2/05 5/05 8/05 11/05 2/06 5/06 8/06 11/06 2/07 5/07 8/07 11/07 2/08 5/08 8/08 MRR calculation base Allocated marginal reserve requirements Source: CNB.
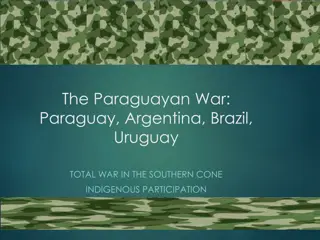
31 Problem without the solution until the euro adoption Share of FX loans and deposits in Ukraine Indebtedness of domestic sectors in Croatia, currency structure, Dec 2022 High informal euroization in Croatia (eventually resolved by euro adoption) 90 90 70 65% 60% 80 80 60 55% 50 50% Debt, in % of GDP 70 70 51 % 45% % 40 40% 60 60 43 30 35% 50 50 30% 16 20 25% 40 40 10 18 20% 2004 2005 2006 2007 2008 2009 2010 2011 2012 2013 2014 2015 2016 2017 2018 2019 2020 2021 2022 14 12 01.20 01.06 05.08 09.10 Dollarization of deposits 01.13 05.15 09.17 05.22 0 Share of fx credit to total credit (incl. general government) Share of fx deposits in total deposits (incl. demand deposits) Share of fx deposits in total deposits (excl. demand deposits) Households Corporates General government FX Dollarization of loans Local currency Source: CNB. Source: Ukranian National Bank
32 Some lessons from the war and aftermath of the war War even a very destructive one - does not bring permanent ruin o Phoenix miracles are even somewhat of a norm as multitude of factors pushes-up growth However, structural reforms are needed in order to maximize the rebound and make it sustainable likely problems after the war destroyed assets, spill-over to good assets thru the banking system exposures elevated public debt low labour force participation rate (emmigration, brain drain, war veterans...) macroeconomic instability, inflation, exchange rate currency substitution? business climate
33 Some lessons from the war and aftermath of the war Central bank should focus on two areas price stability and financial stability Prices can be stabilized even during the war, which further supports growth Wars kill many people and damage physical property but they also hurt balance sheets of banks these need to be repaired as soon as possible when the shooting stops o o When the reconstruction starts, keep an eye on capital inflows and stay vigilant on macro-prudential front in order to manage the boom-bust cycle Monetary policy in the aftermath of the war may not fully regain manoeuvring space, particularly if dollarization (euroization) is high (even before the war)
34 THANK YOU.